Can anyone help me make a graph?
 01-07-2013, 01:40 AM
#1
Senior Member
Thread Starter
iTrader: (1)

Join Date: Aug 2006
Location: Illinois
Posts: 1,011
Total Cats: 7
...or point me to some software that can? I have bunch of dyno numbers that I need plotted.
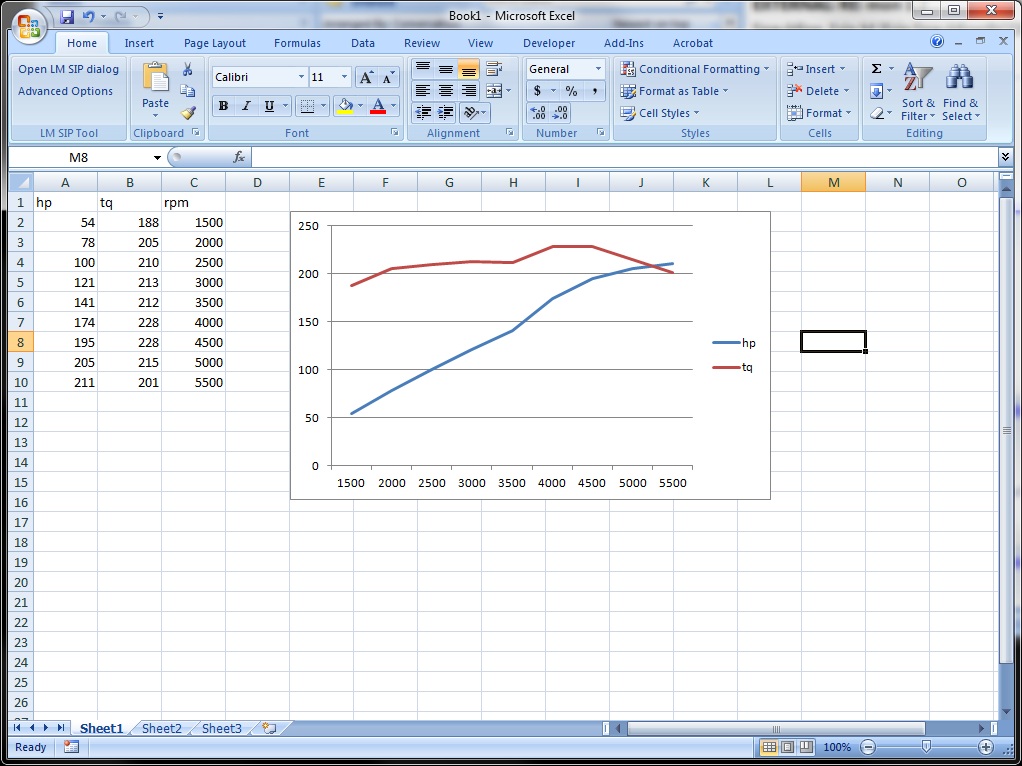
I took some rwhp figures from an engine and added 15% to get this...
53.94hp 188.86ft 1500rpm
78.32hp 205.67ft 2000rpm
100.17hp 210.44ft 2500rpm
121.79hp 213.21ft 3000rpm
141.80hp 212.78ft 3500rpm
174.23hp 228.76ft 4000rpm
195.39hp 228.04ft 4500rpm
205.05hp 215.38ft 5000rpm
211.14hp 201.62ft 5500rpm
Can anyone help graph that?
Last edited by lazzer408; 01-07-2013 at 02:24 AM.

Reply
 0
0

0


 01-07-2013, 11:53 AM
#8
Boost Czar


iTrader: (62)
Join Date: May 2005
Location: Chantilly, VA
Posts: 79,493
Total Cats: 4,080
highlight coulmns a and b.
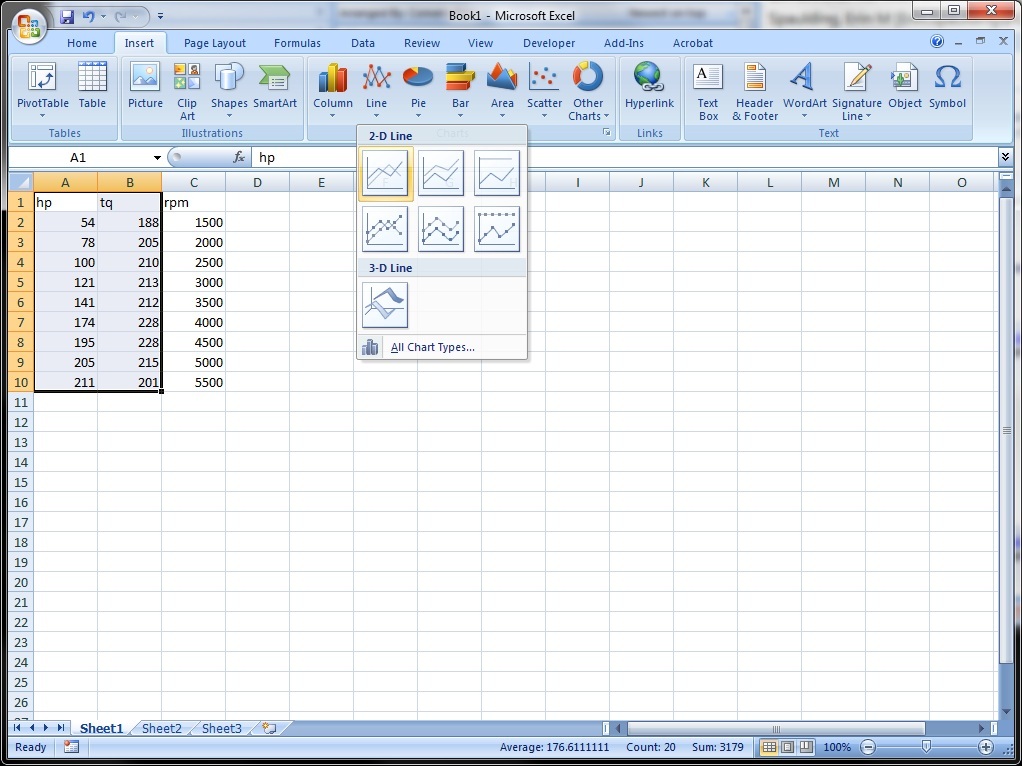
go to insert, then click line graph and the first option for a line graph.
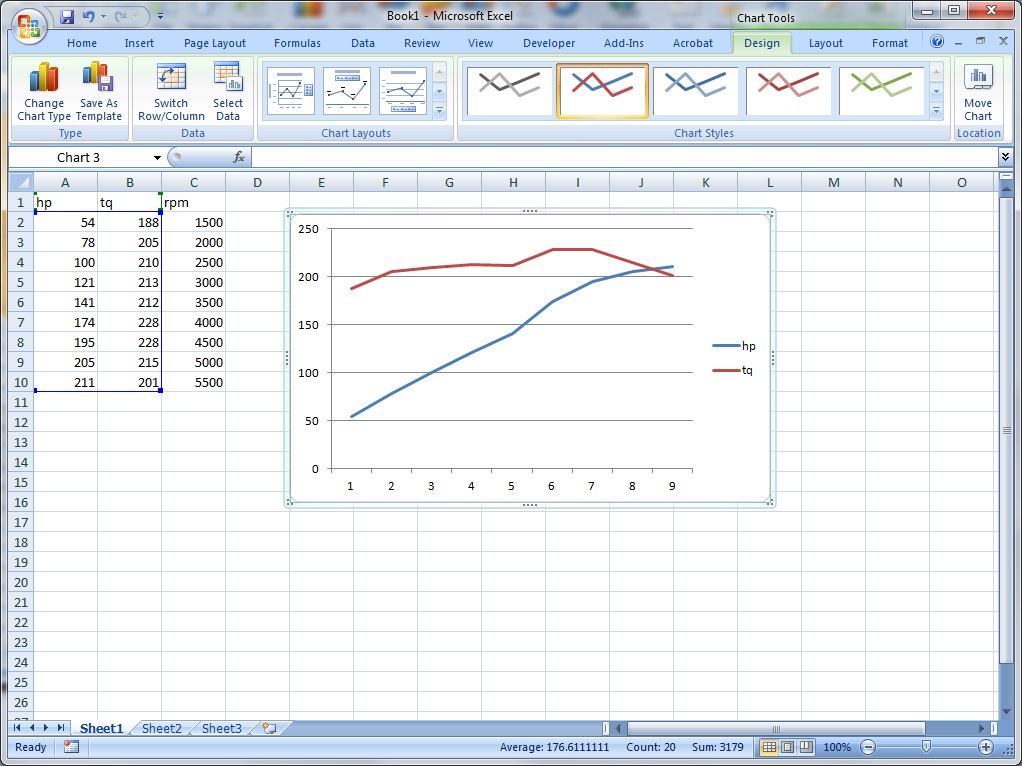
it will insert one that looks close, but the x axis is 1-10.
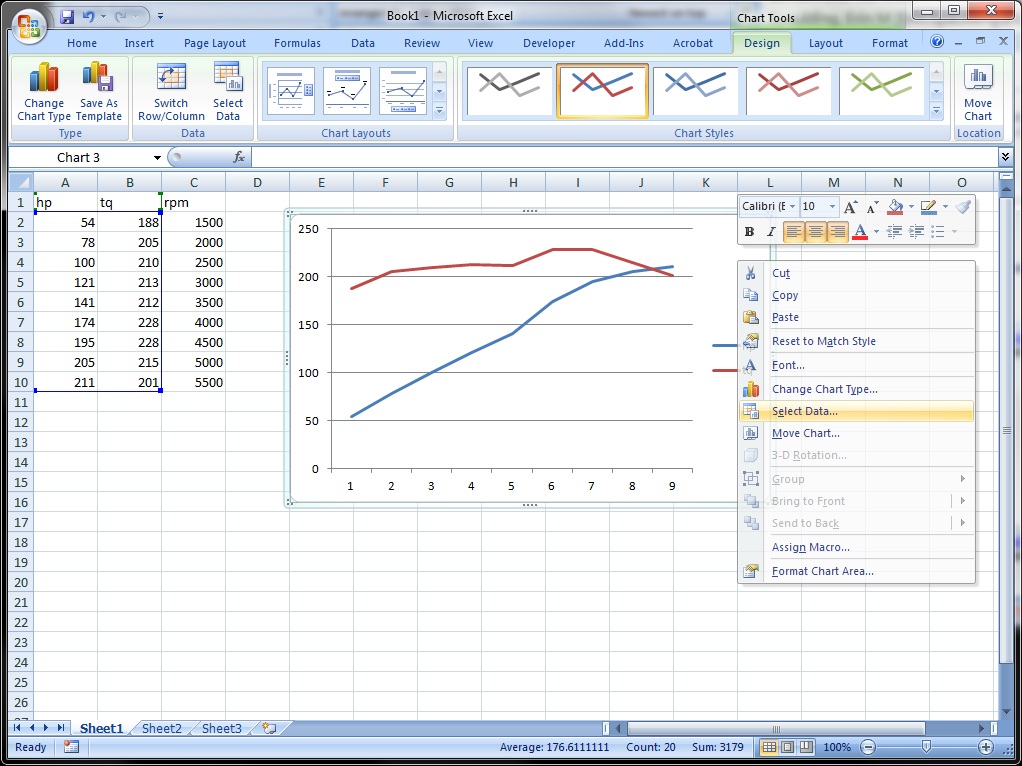
right click the graph and click select data. under horizontal axis labels, click edit. select the values of the c column.
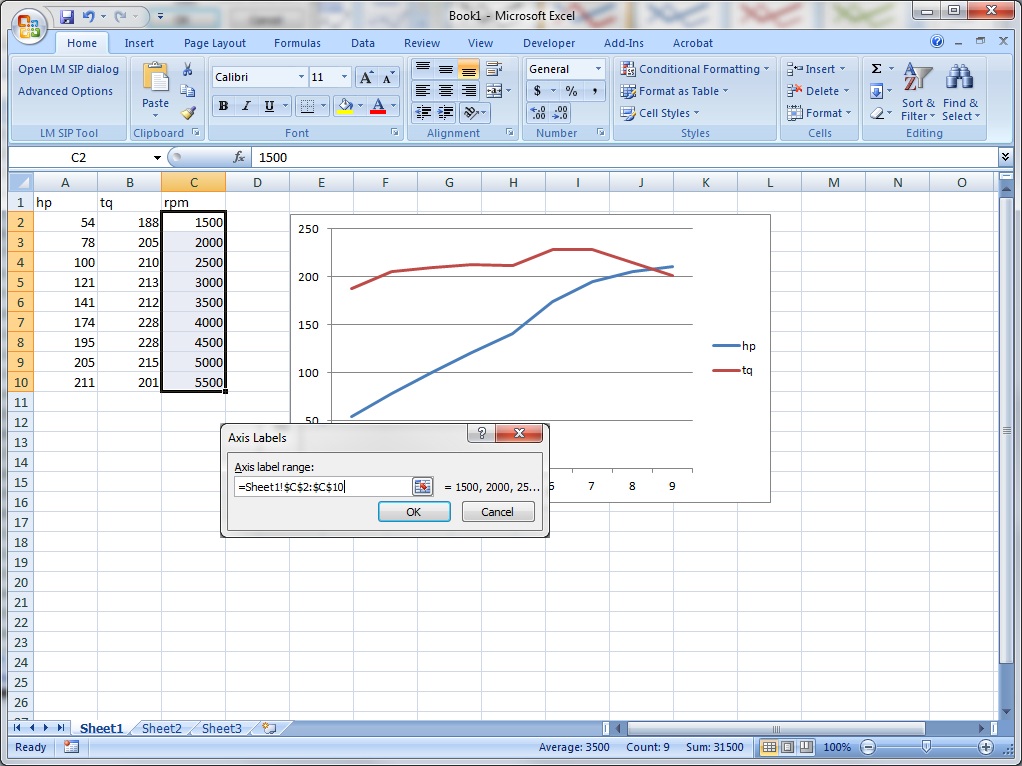
the end.
under the design tab, you can add in axis labeling and titles and such.
go to insert, then click line graph and the first option for a line graph.
it will insert one that looks close, but the x axis is 1-10.
right click the graph and click select data. under horizontal axis labels, click edit. select the values of the c column.
the end.
under the design tab, you can add in axis labeling and titles and such.
Reply
0
0
 01-07-2013, 12:04 PM
#10
Senior Member
Thread Starter
iTrader: (1)
Join Date: Aug 2006
Location: Illinois
Posts: 1,011
Total Cats: 7
highlight coulmns a and b.
go to insert, then click line graph and the first option for a line graph.
it will insert one that looks close, but the x axis is 1-10.
right click the graph and click select data. under horizontal axis labels, click edit. select the values of the c column.
the end.
under the design tab, you can add in axis labeling and titles and such.
Reply
0
0
 01-07-2013, 12:42 PM
#13
Senior Member
Thread Starter
iTrader: (1)
Join Date: Aug 2006
Location: Illinois
Posts: 1,011
Total Cats: 7
It is impossible to hear one's tone of voice through text and thus it is impossible to sense their emotional state. If your expectations were to anger me, then you have failed. You have also proven it was your intent to provoke an unnecessary emotion. In other words, niggeh don't make me go all Data on yo' ***. 

Reply
0
0
01-12-2013, 10:04 AM
#14
Junior Member

Join Date: Sep 2011
Location: finger lakes NY
Posts: 433
Total Cats: 17
It's reasonable to ask for help. It's not reasonable to ask the helper to invest more effort than you. Brain probably spent five minutes preparing that tutorial. Did you spend at least that much time with the Excel help system or Google before asking?
Reply
0
0
01-12-2013, 01:34 PM
#16
Senior Member
Thread Starter
iTrader: (1)
Join Date: Aug 2006
Location: Illinois
Posts: 1,011
Total Cats: 7
I think knowledge has been our weapons against each other in the past. 
DaveC - Of course I did. I downloaded 3 or 4 "free" programs designed to graph values but they ended up being graphing calculators. I didn't know Excel could do it. Not that I have $400 to drop on MS office anyway.
I enjoy helping others when I can. It saddens me knowing so many people would rather see others struggle then offer assistance.
Reply
0
0
 01-12-2013, 02:42 PM
#19

docs.google.com
The spreadsheet program isn't as beefy as excel, but it will graph what you need and has a web interface.
EDIT: Check out: https://docs.google.com/spreadsheet/...waWhLakE#gid=0
The spreadsheet program isn't as beefy as excel, but it will graph what you need and has a web interface.
EDIT: Check out: https://docs.google.com/spreadsheet/...waWhLakE#gid=0
Reply
0
0