
Help me interpret my dyno plot
 09-21-2016, 08:50 PM
#1
Junior Member
Thread Starter

Join Date: Sep 2010
Location: Dallas, TX
Posts: 88
Total Cats: 8
Preparing to NASA Time Trial my NA FM turbo miata. First dyno since I bought the car. Candidly I have very little experience interpreting dyno results. My initial reaction is that the hp and tq curves look pretty good. And 5 pulls yielded a very small delta change. The car does run pretty cool. It was 90 and humid. Would love your feedback.

Reply
 0
0

0
09-21-2016, 09:22 PM
#5
Elite Member

Join Date: Mar 2007
Location: Santa Clara, CA
Posts: 5,165
Total Cats: 855
Is it a 1.6 or a 1.8?
Torque is a bit low at 180 ft-lbs. For most cars, if you take torque and divide it by displacement times atmospheres, you get a number in the high 60s to low 70s. For a 1.6, that would be 2.88 (1.6*1.8) so with 180 ft-lbs that's 62 ft-lbs/L-atm. With a 1.8 it's only 55.
Perhaps boost is lower than 12? Or maybe the motor is tired, or maybe it just wants more timing. Did you tune the timing, or is this the default (i.e., conservative) FM map?
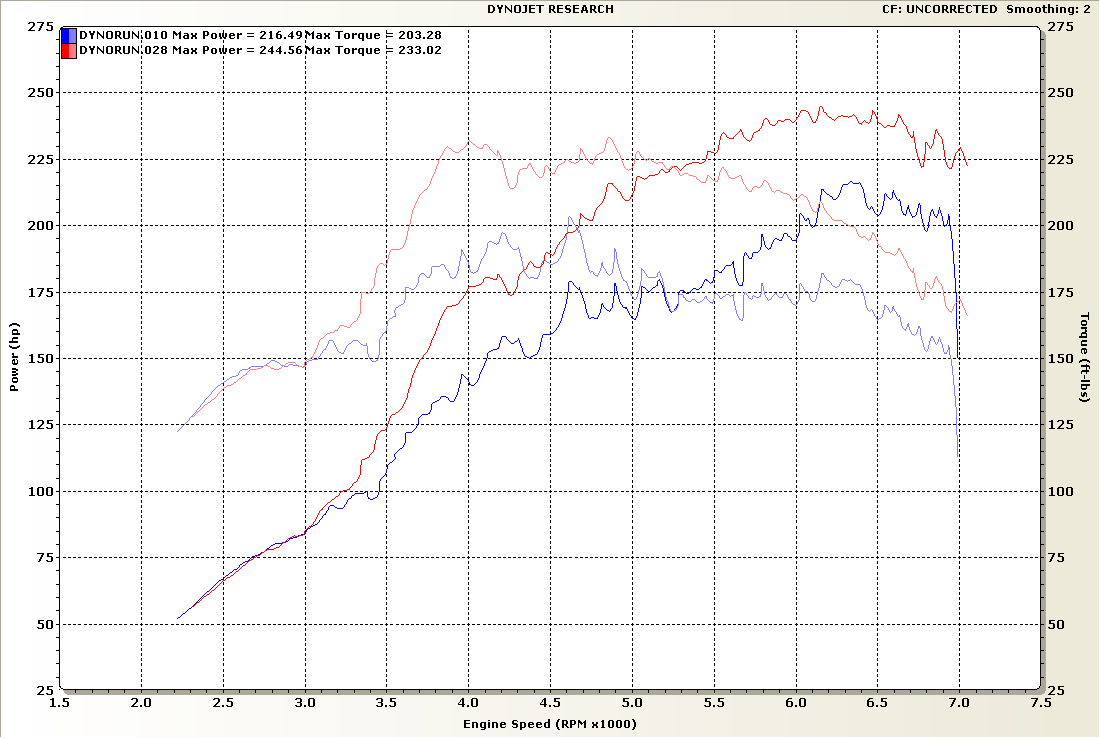
FWIW, this was my car at 12 psi using the FM default Hydra map (blue) vs the after-tuning results (red) when it was a stock '99 1.8 and a 2560 about 8 or 9 years ago:
BTW, I would definitely go out and do some data logging/fuel auto tuning. If it's really doing 13:1 at 12 psi, that's something you should fix. I like to see something in the 11.5 to 12 range.
--Ian
Torque is a bit low at 180 ft-lbs. For most cars, if you take torque and divide it by displacement times atmospheres, you get a number in the high 60s to low 70s. For a 1.6, that would be 2.88 (1.6*1.8) so with 180 ft-lbs that's 62 ft-lbs/L-atm. With a 1.8 it's only 55.
Perhaps boost is lower than 12? Or maybe the motor is tired, or maybe it just wants more timing. Did you tune the timing, or is this the default (i.e., conservative) FM map?
FWIW, this was my car at 12 psi using the FM default Hydra map (blue) vs the after-tuning results (red) when it was a stock '99 1.8 and a 2560 about 8 or 9 years ago:
BTW, I would definitely go out and do some data logging/fuel auto tuning. If it's really doing 13:1 at 12 psi, that's something you should fix. I like to see something in the 11.5 to 12 range.
--Ian
Reply
0
0
09-21-2016, 09:24 PM
#6
mkturbo.com

iTrader: (24)
Join Date: May 2006
Location: Charleston SC
Posts: 15,176
Total Cats: 1,680
On a track car I would be shooting for 11.8:1 in boost.Those AFR's would leave me a bit worried. There might not be any knock on the dyno, but after a 20 min track session things will be much warmer.
Reply
0
0
09-21-2016, 09:52 PM
#7
Junior Member
Thread Starter
Join Date: Sep 2010
Location: Dallas, TX
Posts: 88
Total Cats: 8
Thanks all. I have an external boost gauge that is reading 12psi peak. I know the motor is at least the 3rd replacement but origin is unknown. It is a stock 1.8. It very well could be tired. We did tune the timing but I think it could be tweaked. It is not the default FM map. Car runs very cool on track. 20 minute session and water temps are about 205 and oil is about 200. Car has an oil cooler, coolant reroute and I've boxed in the radiator/intercooler.
Reply
0
0
09-22-2016, 12:30 PM
#9
Junior Member

Join Date: Sep 2006
Location: Reading PA
Posts: 165
Total Cats: 56
AFRs measured with the WBO2 connected to the Dynojet at the tail pipe read about 1 point leaner than actual. Do you have a data log from the Hydra showing the AFR measured by the WBO2 connected to the Hydra?
Your power and toque curves look typical for a Hydra with FM's base map. Plenty of fuel, and a little weak due to conservative timing map.
Your power and toque curves look typical for a Hydra with FM's base map. Plenty of fuel, and a little weak due to conservative timing map.
Reply
1
1
09-22-2016, 01:15 PM
#10
Junior Member
Thread Starter
Join Date: Sep 2010
Location: Dallas, TX
Posts: 88
Total Cats: 8
AFRs measured with the WBO2 connected to the Dynojet at the tail pipe read about 1 point leaner than actual. Do you have a data log from the Hydra showing the AFR measured by the WBO2 connected to the Hydra?
Your power and toque curves look typical for a Hydra with FM's base map. Plenty of fuel, and a little weak due to conservative timing map.
Your power and toque curves look typical for a Hydra with FM's base map. Plenty of fuel, and a little weak due to conservative timing map.
Philip
Reply
0
0

Thread
Thread Starter
Forum
Replies
Last Post
KMiata
Engine Performance
8
09-20-2016 01:31 AM


