
Lateral G - Data Analyses question.
 12-16-2014, 03:03 AM
#1
Senior Member
Thread Starter

Join Date: Dec 2010
Location: Auckland, NZ
Posts: 992
Total Cats: 57
I recently tested at one of our series race tracks and for the first time have had the Aim Evo4 and MXL unit installed and working.
It is very interesting reviewing laps and all the different data info and graphs it throws out.
However, not having a base line to work from I am interested to know....
Playing around with the Race Studio Analyses software shows the car achieved a max 1.34 G load.
Is this about where our cars can usually get to/ or normal....
Should I be aiming higher?
Does this reading seem incorrect / out of range for what our cars can/could/should achieve?
Reminder: 89 Mx5 on 15x9 6ULS with Nitto NT01 tyres (about a season old) approx 950kg.
Interested in any thoughts, experience etc.

Reply
 0
0

0
12-16-2014, 08:45 AM
#2
Senior Member
iTrader: (1)

Join Date: Dec 2010
Location: Farmington Hills, MI
Posts: 1,218
Total Cats: 175
Do you have any data plots? Is 1.34 G a peak value or is the data filtered at all? It really depends on where you saw 1.34 G's to dictate whether or not that's good. For example, our FSAE car will sustain about 1.35 G's steady state on a skid pad, however will see an average (after filtering) of around 1.6-1.7 G's in transients, and can peak over 2.0 G.
Reply
0
0
 12-16-2014, 03:09 PM
#4
Senior Member
Thread Starter
Join Date: Dec 2010
Location: Auckland, NZ
Posts: 992
Total Cats: 57
1.34 was a peak in a slightly cambered 3rd gear (I run a 6 speed) hairpin.
What I wanted to know was this in the ball park and it appears that it must be.
I presume Aceduece and Mr Hyde, that aero is the reason you have significantly higher figures...
Anyone have any reference they can share on an un "aero'd" or winged car?
What I wanted to know was this in the ball park and it appears that it must be.
I presume Aceduece and Mr Hyde, that aero is the reason you have significantly higher figures...
Anyone have any reference they can share on an un "aero'd" or winged car?
Reply
0
0
12-16-2014, 05:15 PM
#5

Numerous vids in this link that show a friction circle: https://www.miataturbo.net/build-thr...1/#post1189366
1.3 is right in the ballpark of what I see using BFG Rivals and, now, Maxxis RC-1s. The Maxxis tire is pretty similar to an NT01 I think.
1.3 is right in the ballpark of what I see using BFG Rivals and, now, Maxxis RC-1s. The Maxxis tire is pretty similar to an NT01 I think.
Reply
0
0
12-16-2014, 05:21 PM
#6

I'm not sure if you need to have a paid version of Race Studio to do this but you can make a histogram scatter plot or acceleration data and the outer envelop is essentially your traction circle.
EDIT: NOT MY CAR. Not even a miata. Just a random google image.

EDIT: NOT MY CAR. Not even a miata. Just a random google image.
Last edited by cyotani; 12-16-2014 at 10:01 PM.
Reply
0
0
12-16-2014, 08:58 PM
#7
Supporting Vendor

iTrader: (3)

Join Date: Jul 2006
Location: San Diego
Posts: 3,303
Total Cats: 1,216
Took me a minute to figure out how to do it, but looks like you don't need the paid version to plot histograms.
What is technically considered 'steady' state when viewing track data as opposed to being able to test on a skidpad? 1 second? 3 seconds? My data fluctuates throughout a turn as I adjust the attitude of the car, etc...
I'm seeing 1.55-1.6 momentary peaks, usually in the first 1/3rd of a turn, with a more steady 1.45-1.5 in some turns
(on old NT01s)
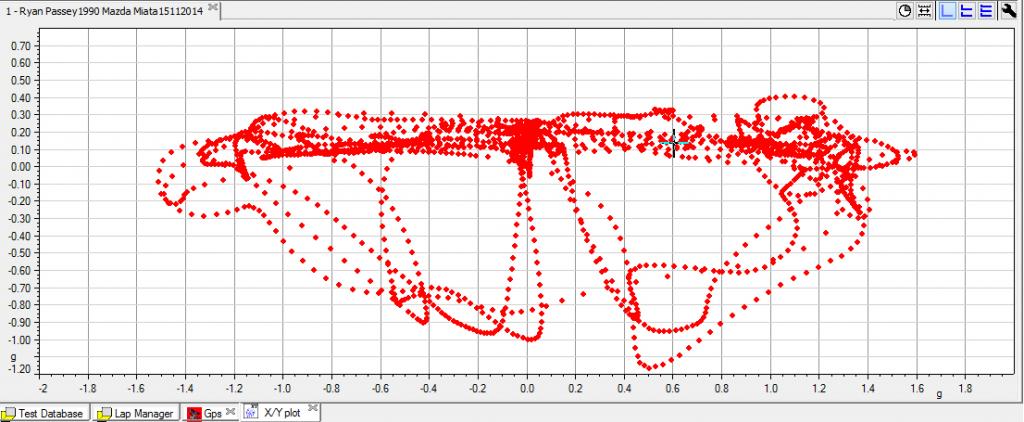
-Ryan
What is technically considered 'steady' state when viewing track data as opposed to being able to test on a skidpad? 1 second? 3 seconds? My data fluctuates throughout a turn as I adjust the attitude of the car, etc...
I'm seeing 1.55-1.6 momentary peaks, usually in the first 1/3rd of a turn, with a more steady 1.45-1.5 in some turns
(on old NT01s)
-Ryan

Last edited by ThePass; 12-16-2014 at 09:10 PM.
Reply
0
0
12-16-2014, 09:18 PM
#8


Here's a 1:25 lap at MSR-C 1.7CCW (no-aero and same orientation as cyotani for braking/acceleration):
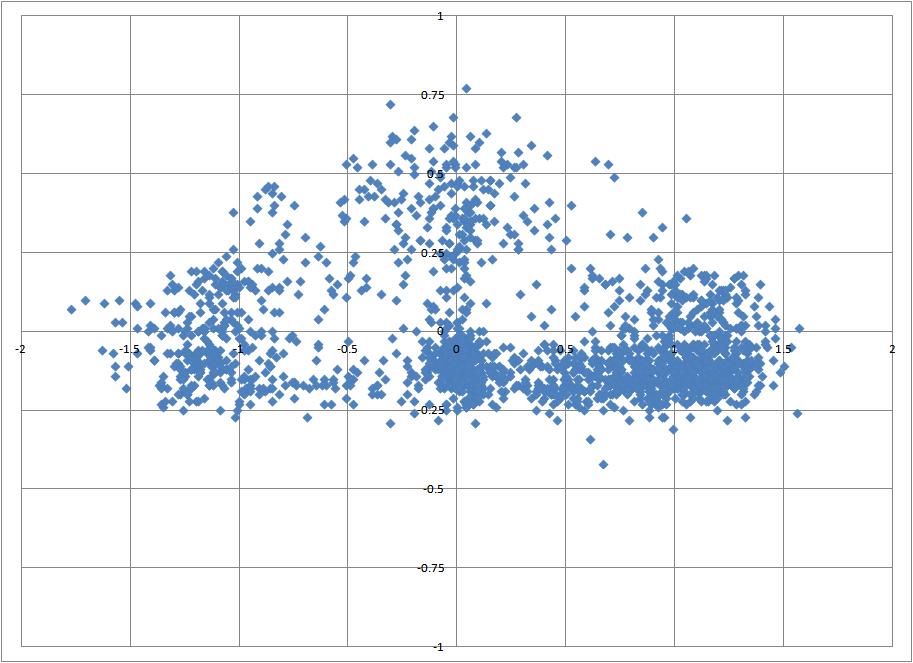
My lap isn't as clean as you other guys, have lots of hits where I should have holes. Need to work on that.
Last edited by hornetball; 12-16-2014 at 09:50 PM.
Reply
0
0
12-16-2014, 10:53 PM
#9
Senior Member
Thread Starter
Join Date: Dec 2010
Location: Auckland, NZ
Posts: 992
Total Cats: 57
Hey that is great data there guys!
I'll have to figure out race studio for the scatter plot. Thank you.
Also answers some questions about aero versus non aero....I asked once before and someone else recently did too about quantifying aero gains.....over in the Aero thread.
I'll have to figure out race studio for the scatter plot. Thank you.
Also answers some questions about aero versus non aero....I asked once before and someone else recently did too about quantifying aero gains.....over in the Aero thread.
Reply
0
0
12-17-2014, 12:12 AM
#10
Hey that is great data there guys!
I'll have to figure out race studio for the scatter plot. Thank you.
Also answers some questions about aero versus non aero....I asked once before and someone else recently did too about quantifying aero gains.....over in the Aero thread.
I'll have to figure out race studio for the scatter plot. Thank you.
Also answers some questions about aero versus non aero....I asked once before and someone else recently did too about quantifying aero gains.....over in the Aero thread.
Reply
0
0


Thread
Thread Starter
Forum
Replies
Last Post


