
Custom acceleration graph generator
 09-21-2016, 11:20 AM
#1
Junior Member

Thread Starter

Join Date: May 2012
Location: NYC
Posts: 260
Total Cats: 58
I can't attach a .xlsm file. Here's a link to download it from my google drive. https://drive.google.com/open?id=0Bx...l84MnJYbEpEUVU
First off - I'm 90% sure these graphs are accurate, not counting drag, but want feedback. Is this **** all wrong? Idk, I was an English major.
My setup has been 4.1, 5 speed, N/A ~150whp for a while now. I recently grabbed 4.77 kia gears from local yard and swapped them in, along with poly bushing to replace my 150k mile OEM rubbers. The car is silly fun, and I can't wait to get it on track in a few weeks.
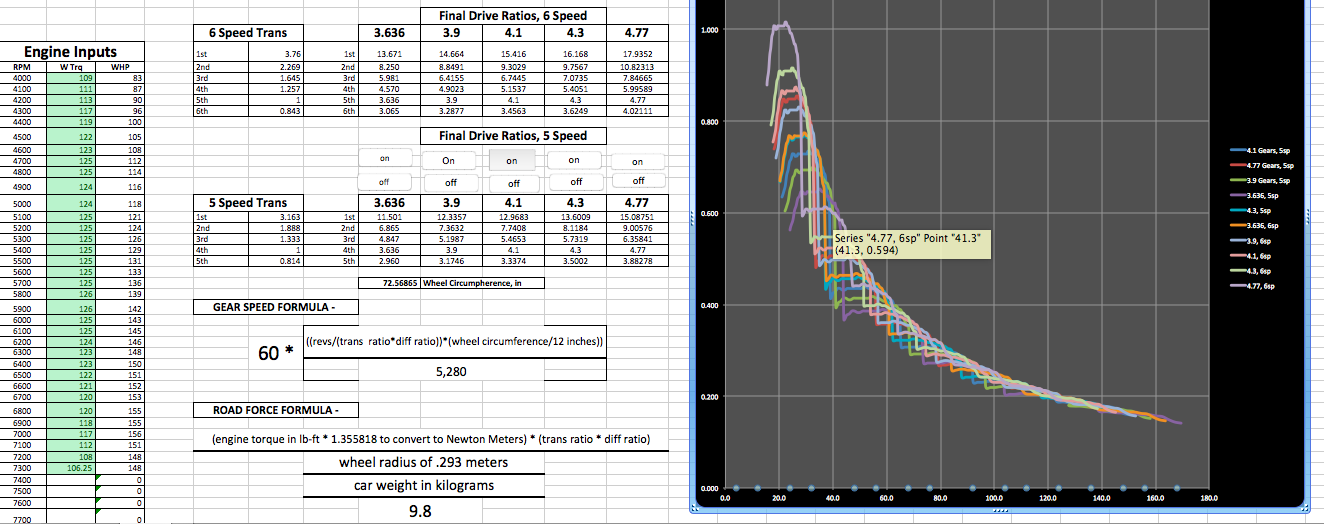
Before doing it though, I wanted a better visual of what the gear changes would do to shift points and acceleration and since the internet was failing me, I built my own road force/acceleration graph generator. Every Miata diff ratio combined with both transmissions, and simple macros to hide columns, turning different options on or off in the chart. Import your comp weight and torque numbers every 100rpm from 4000rpm to redline, and you can use it too. The main issue with this chart is it's setup for my redline, 7300. If yours is lower or higher, you need to adjust the tables a bit. (I can explain more if needed.)
Output acceleration is in g's. Converting everything to metric made life way easier. For me, the visuals are what matter. I can see my shift points and what combo is better at specific speeds. At Pocono this summer, I wasn't getting much over 125mph (gps), and the 4.77 allows me to be in torque peak pulling out of T5 at NJMP Thunderbolt and a few other key places, so 4.77 was a no brainer.
For those making a lot more power than me at different RPMs, hopefully this can help?
If anyone knows of a better way to change redline and have all the charts follow suit pretty easily, I'd really like to add that automatic functionality.
Part of the sheet with every combo turned on
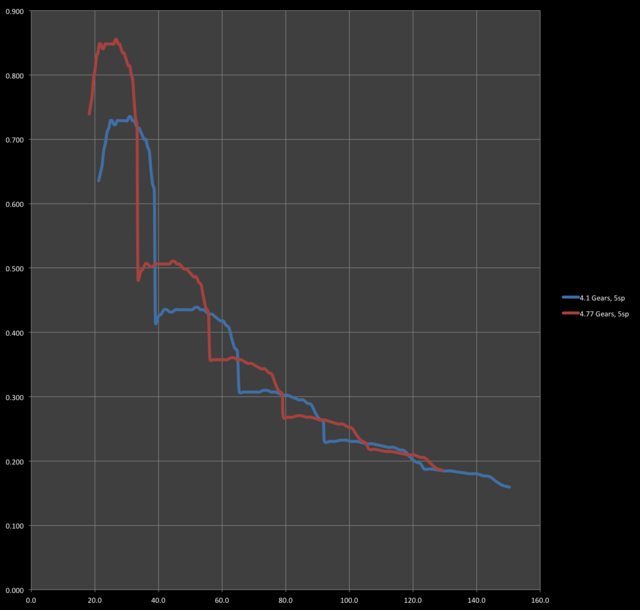
Original intention, 4.1 VS 4.77, both with 5 speed
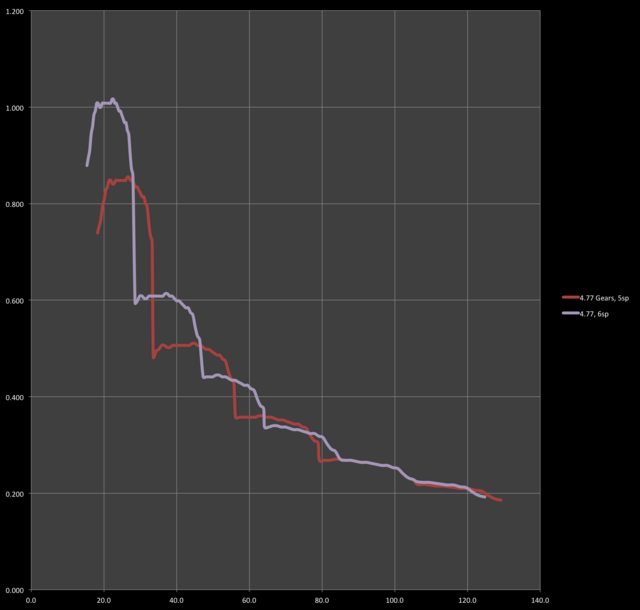
4.77 vs 4.77, 6sp, showing the clear advantage of the 6 speed past 75mph
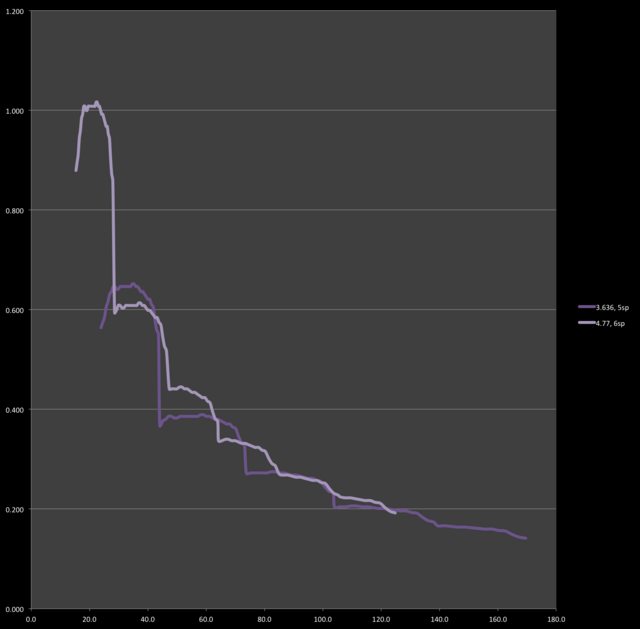
3.636 5sp vs 4.77 6sp
First off - I'm 90% sure these graphs are accurate, not counting drag, but want feedback. Is this **** all wrong? Idk, I was an English major.
My setup has been 4.1, 5 speed, N/A ~150whp for a while now. I recently grabbed 4.77 kia gears from local yard and swapped them in, along with poly bushing to replace my 150k mile OEM rubbers. The car is silly fun, and I can't wait to get it on track in a few weeks.
Before doing it though, I wanted a better visual of what the gear changes would do to shift points and acceleration and since the internet was failing me, I built my own road force/acceleration graph generator. Every Miata diff ratio combined with both transmissions, and simple macros to hide columns, turning different options on or off in the chart. Import your comp weight and torque numbers every 100rpm from 4000rpm to redline, and you can use it too. The main issue with this chart is it's setup for my redline, 7300. If yours is lower or higher, you need to adjust the tables a bit. (I can explain more if needed.)
Output acceleration is in g's. Converting everything to metric made life way easier. For me, the visuals are what matter. I can see my shift points and what combo is better at specific speeds. At Pocono this summer, I wasn't getting much over 125mph (gps), and the 4.77 allows me to be in torque peak pulling out of T5 at NJMP Thunderbolt and a few other key places, so 4.77 was a no brainer.
For those making a lot more power than me at different RPMs, hopefully this can help?
If anyone knows of a better way to change redline and have all the charts follow suit pretty easily, I'd really like to add that automatic functionality.
Part of the sheet with every combo turned on
Original intention, 4.1 VS 4.77, both with 5 speed
4.77 vs 4.77, 6sp, showing the clear advantage of the 6 speed past 75mph
3.636 5sp vs 4.77 6sp

Reply
 0
0

0
 09-21-2016, 01:30 PM
#4
Elite Member
iTrader: (5)
Join Date: Oct 2011
Location: Detroit (the part with no rules or laws)
Posts: 5,677
Total Cats: 800
How is this different than this, other than graph overlays?:
https://www.flyinmiata.com/tech/gearing.php
where do you compensate for tire size?
https://www.flyinmiata.com/tech/gearing.php
where do you compensate for tire size?
Reply
0
0
09-21-2016, 01:38 PM
#5
Junior Member
Thread Starter
Join Date: May 2012
Location: NYC
Posts: 260
Total Cats: 58
The FM gearing calc doesn't show acceleration plots, just top speed in each gear. My graph allows you to see the increases and decreases in torque at the wheels at any given speed.
The wheel size is in the formula at 23.1" diameter, a standard Miata size (205/50-15 and 225/45-15 both equal about this size on paper). I can easily change it so you can enter your wheel size in a cell so it adjusts the plots.
The wheel size is in the formula at 23.1" diameter, a standard Miata size (205/50-15 and 225/45-15 both equal about this size on paper). I can easily change it so you can enter your wheel size in a cell so it adjusts the plots.
Reply
0
0
09-27-2016, 09:13 AM
#6
Junior Member
Thread Starter
Join Date: May 2012
Location: NYC
Posts: 260
Total Cats: 58
This is why I'd like someone to verify that these graphs are accurate.
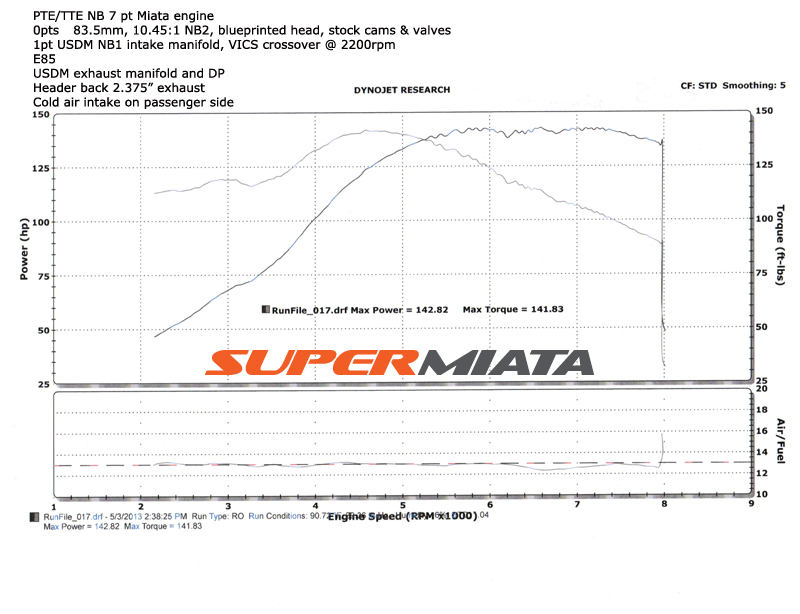
I inputted 949's 143whp TTE car, with nearly flat hp from 5k to 8k. This one (found in the TTE thread).
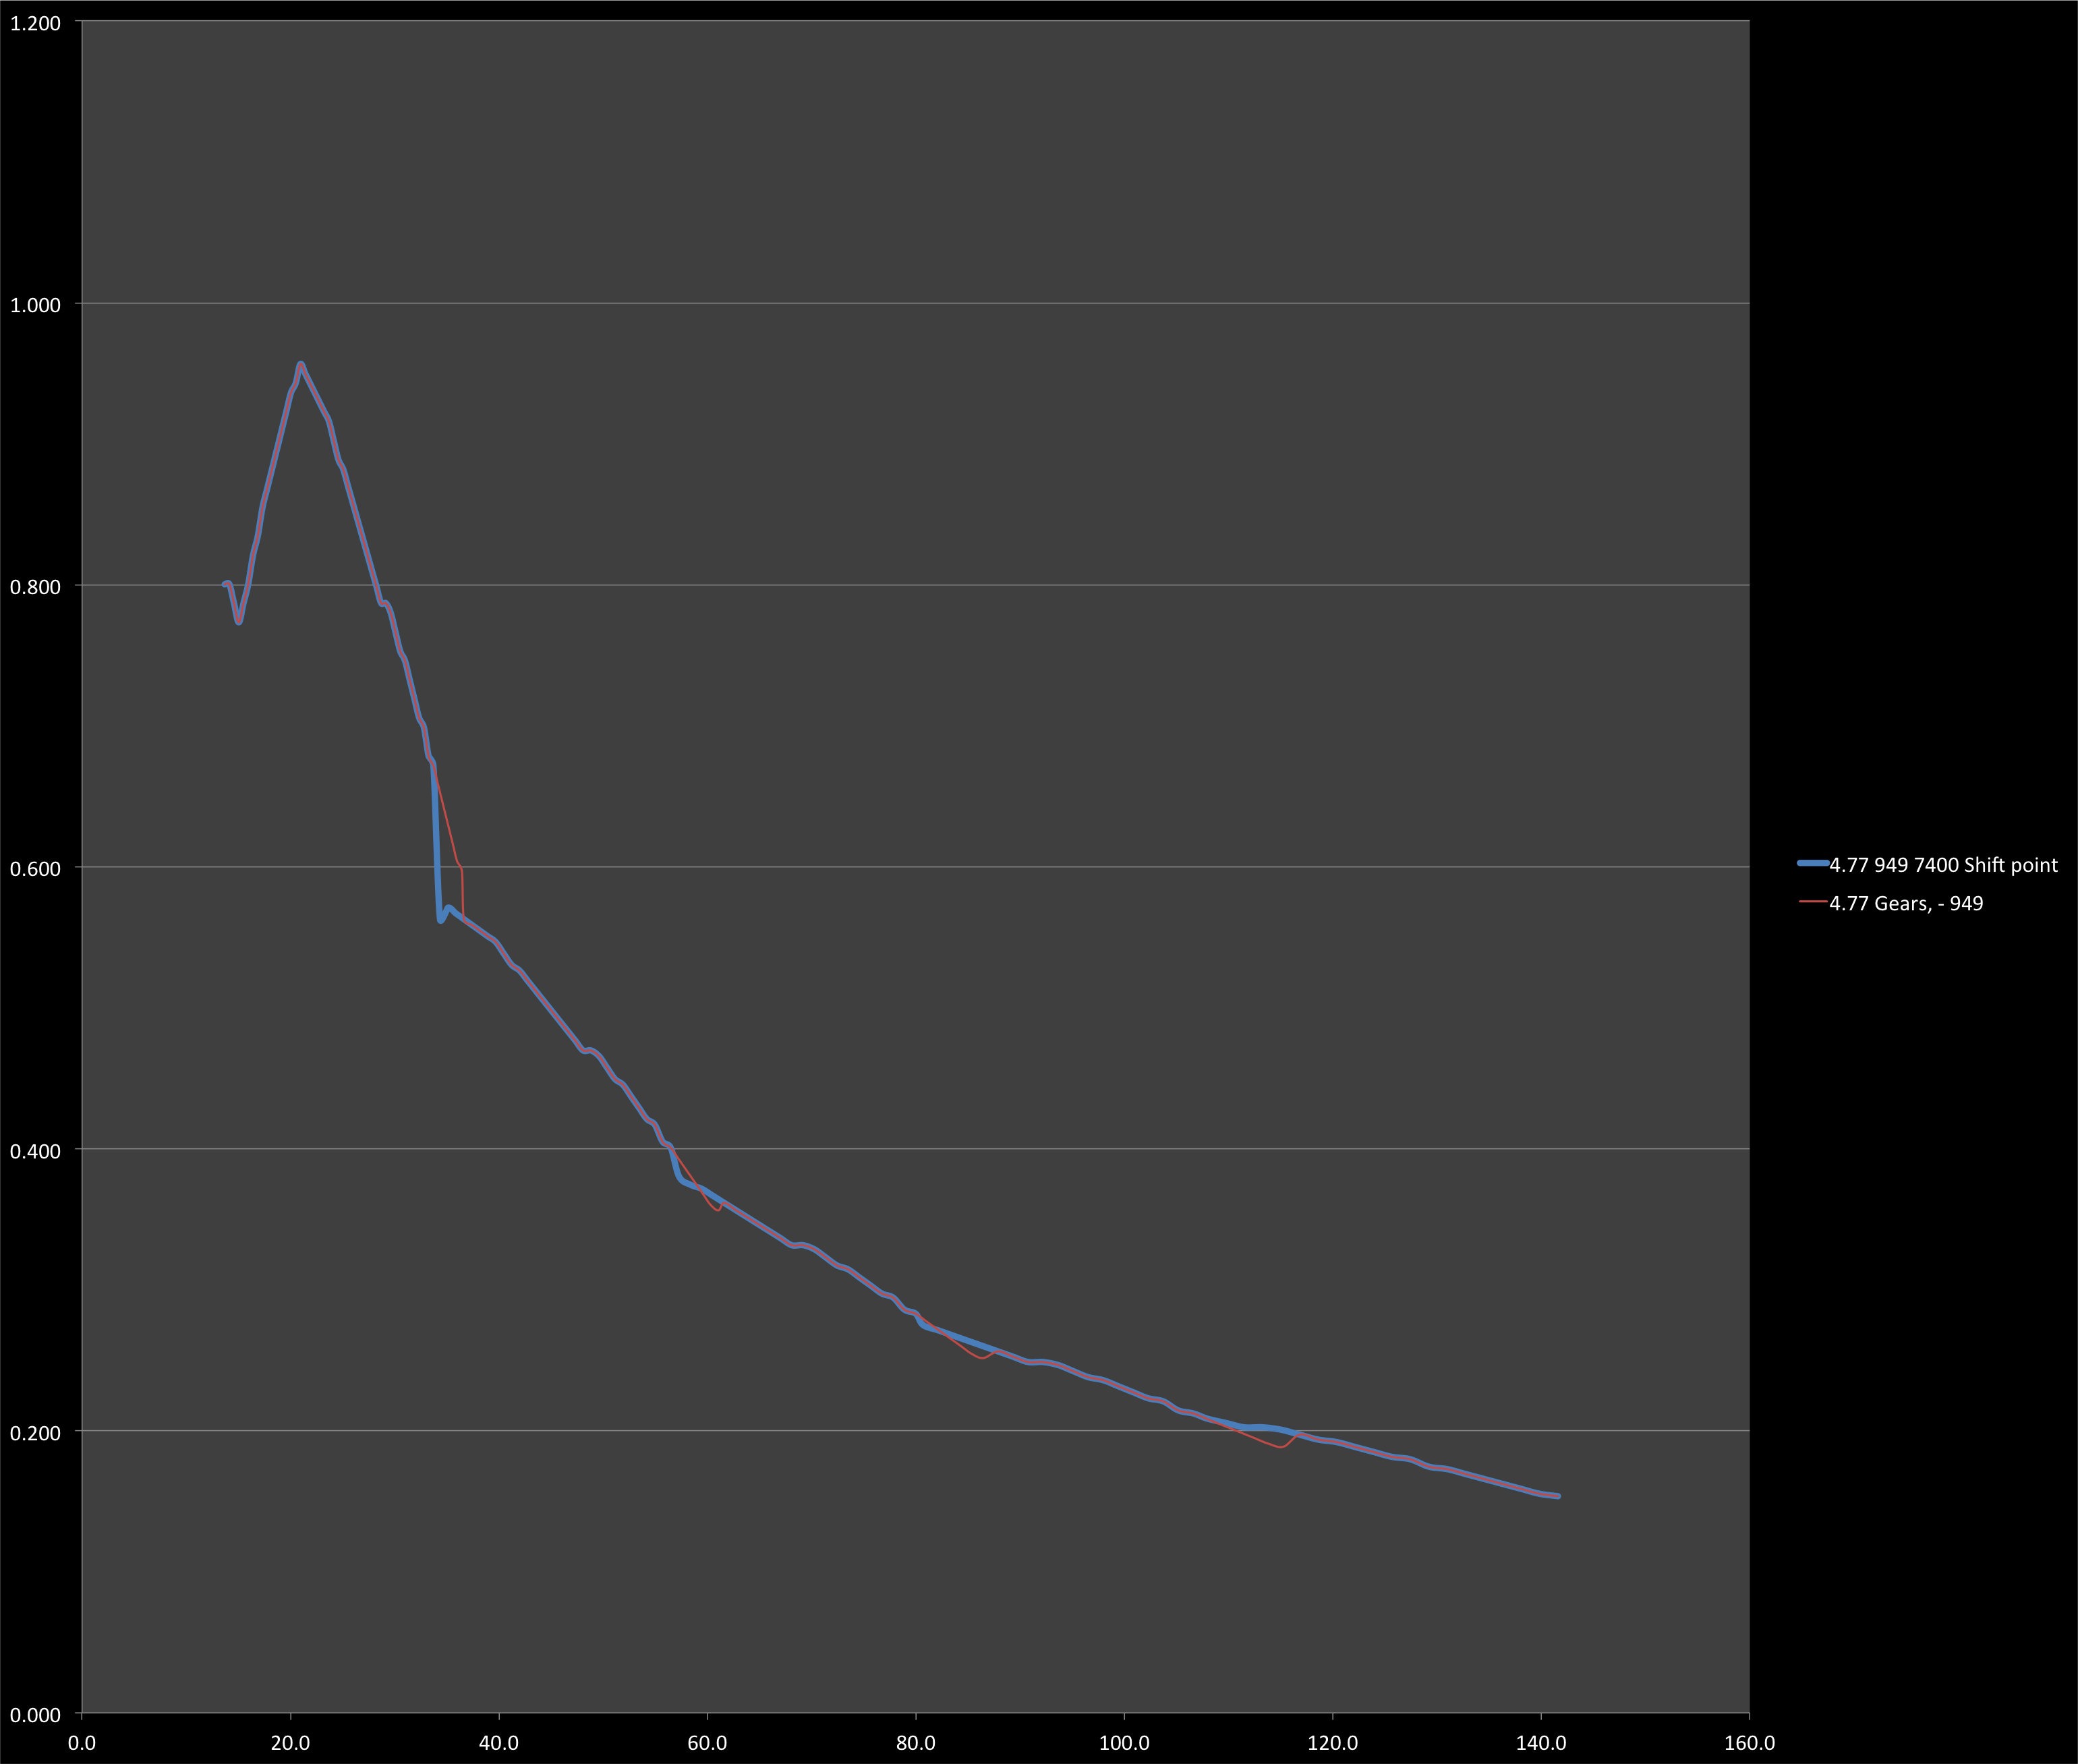
Here's the torque graph. Red line is running each gear out to redline. Blue line is shifting at 7400 each time. The torque drops so precipitously, that from 3rd gear on, there is a small advantage to the short shift.
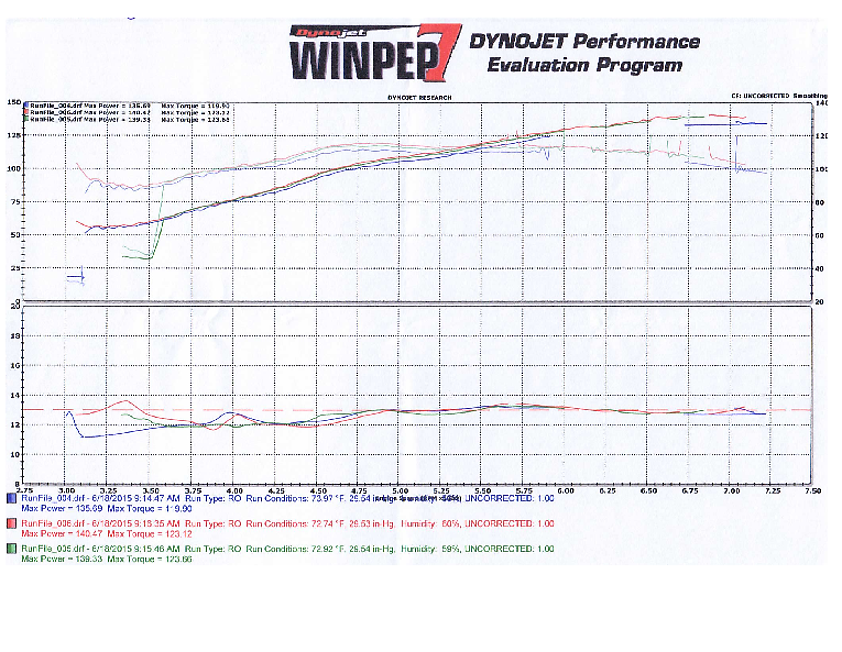
I had a dyno of my car when we ran in uncorrected once, making nearly the same peak hp as Emilio's, 141 peak. Here's that dyno.
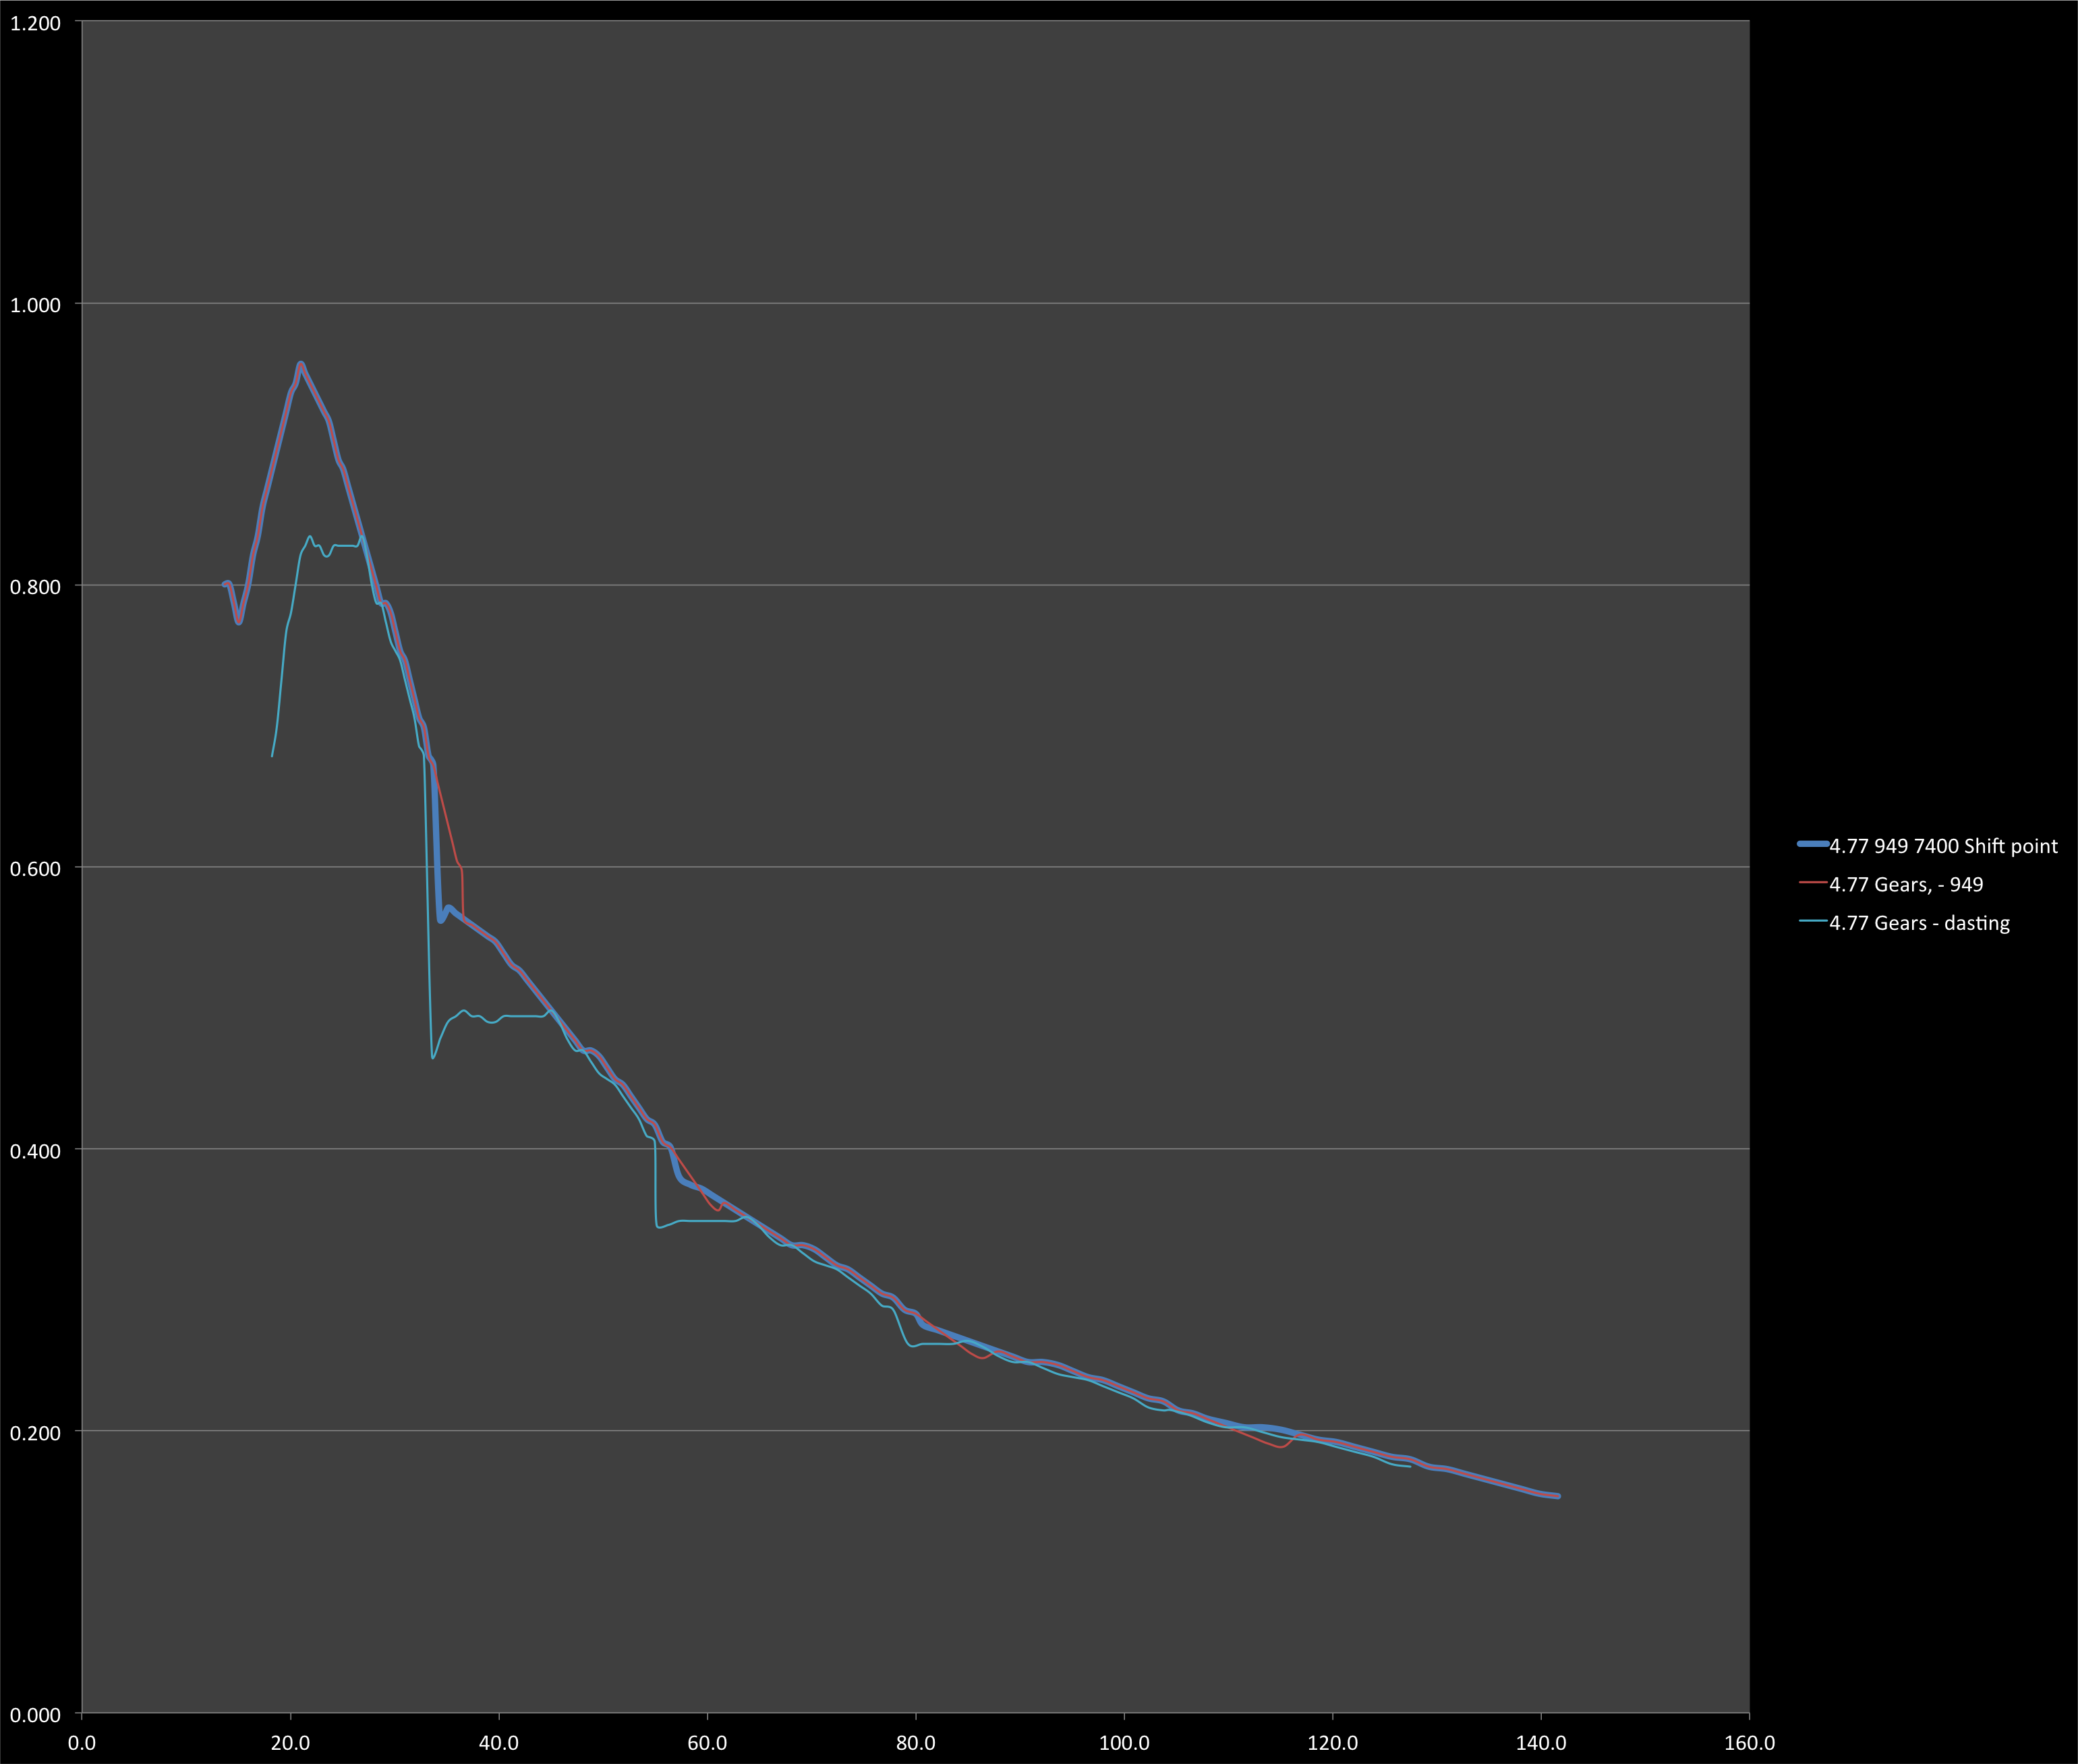
And here's the overlay. You can see the huge advantage of the torque monster 949 car in 1st 2nd and 3rd gears. Interestingly, the advantage wanes to the point that its nearly gone in 5th gear. Granted, the extra chug the 949 motor has at the beginning of 3rd and 4th could be a huge deal pulling out of turns, or even dragging it out, if that scenario were to arise.
I inputted 949's 143whp TTE car, with nearly flat hp from 5k to 8k. This one (found in the TTE thread).
Here's the torque graph. Red line is running each gear out to redline. Blue line is shifting at 7400 each time. The torque drops so precipitously, that from 3rd gear on, there is a small advantage to the short shift.
I had a dyno of my car when we ran in uncorrected once, making nearly the same peak hp as Emilio's, 141 peak. Here's that dyno.
And here's the overlay. You can see the huge advantage of the torque monster 949 car in 1st 2nd and 3rd gears. Interestingly, the advantage wanes to the point that its nearly gone in 5th gear. Granted, the extra chug the 949 motor has at the beginning of 3rd and 4th could be a huge deal pulling out of turns, or even dragging it out, if that scenario were to arise.
Reply
2
2

Thread
Thread Starter
Forum
Replies
Last Post
Wowbagger the I.P.
ECUs and Tuning
10
10-09-2014 08:38 PM
hobbs
Miata parts for sale/trade
11
05-29-2013 01:36 PM


