Virtual Dyno


 Someone needs to start a thread in a place they look at.
 04-23-2013, 08:04 PM
#230
Junior Member

Join Date: Jan 2012
Location: Kansas City, KS
Posts: 66
Total Cats: 3
Keep me posted on the outcomes of it ... I am concerned when loggers start doing this crap. Its non-standard ... beginner programming design to do logs like that. Thats how I honestly feel.

Reply
 0
0

0
06-11-2013, 08:58 AM
#231
Senior Member
iTrader: (1)

Join Date: Sep 2011
Location: Lambertville, NJ
Posts: 1,215
Total Cats: 74
I've just started using VD for tuning and absolutely love it. But of course there is always one more little feature request!
In order to be able to compare apples to apples, I would like to eliminate the influence of intake air temperature on the result. I can already kind of do that by switching VD into SAE mode and entering the average IAT during the run, but if possible I would like even better comparability. My IATs change considerably during a run because of the tiny little intercooler. So a mode where every data-point gets corrected for IAT would be totally awesome!
In order to be able to compare apples to apples, I would like to eliminate the influence of intake air temperature on the result. I can already kind of do that by switching VD into SAE mode and entering the average IAT during the run, but if possible I would like even better comparability. My IATs change considerably during a run because of the tiny little intercooler. So a mode where every data-point gets corrected for IAT would be totally awesome!
Reply
0
0
06-11-2013, 10:22 AM
#232
Boost Czar


iTrader: (62)
Join Date: May 2005
Location: Chantilly, VA
Posts: 79,501
Total Cats: 4,080
I'd like to be able to graph the extra things. Boost and AFR never shows up in the graphs correctly and I can only plot other the data on another chart that I cant export with the TQ/HP plot. We should be able to select those things to put on the main power plot, more like the winpep7 software.
Reply
0
0
09-19-2013, 04:00 PM
#233

The point of the SAE correction is to correct the output for current temperature and pressure conditions so they can be compared (imperfect, but much better than nothing). The problem is that the pressure input requested by VD is “Barometer.” Barometer readings reported by the weather service are not straight pressure readings. Rather, they are pressure readings corrected to Sea Level. This is done because aicraft altimeters work in this fashion and it also allows meteorologists to directly compare a barometer reading from, say, Colorado to one from Louisiana to identify low and high pressure areas. Wikipedia has a brief description of barometer compensations here: Barometer - Wikipedia, the free encyclopedia. Altitude-based correction tables are here: http://www.novalynx.com/manuals/bp-e...ion-tables.pdf.
Here’s a worked example from the other day. I did several runs near Granbury, TX (elevation ~900’). I wanted to SAE correct these so that I could compare them later. Getting the current observation on my smartphone showed a temperature of 92�F and barometer of 30.02”Hg. To get actual pressure, I go into the tables and look up the elevation correction for 900' (0.96”Hg). Subtracting the correction from the reported barometer reading, I get 29.06”Hg as the actual pressure. I plug 92�F and 29.06”Hg into VD to get an accurate SAE correction.
This should help you guys in NM and CO.
Hopefully, VD will have an "Elevation" or "Altitude" input for the SAE correction soon.
Reply
0
0
09-19-2013, 04:04 PM
#234
The point of the SAE correction is to correct the output for current temperature and pressure conditions so they can be compared (imperfect, but much better than nothing). The problem is that the pressure input requested by VD is �Barometer.� Barometer readings reported by the weather service are not straight pressure readings. Rather, they are pressure readings corrected to Sea Level. This is done because aicraft altimeters work in this fashion and it also allows meteorologists to directly compare a barometer reading from, say, Colorado to one from Louisiana to identify low and high pressure areas. Wikipedia has a brief description of barometer compensations here: Barometer - Wikipedia, the free encyclopedia. Altitude-based correction tables are here: http://www.novalynx.com/manuals/bp-e...ion-tables.pdf.
Here�s a worked example from the other day. I did several runs near Granbury, TX (elevation ~900�). I wanted to SAE correct these so that I could compare them later. Getting the current observation on my smartphone showed a temperature of 92�F and barometer of 30.02�Hg. To get actual pressure, I go into the tables and look up the elevation correction for 900' (0.96�Hg). Subtracting the correction from the reported barometer reading, I get 29.06�Hg as the actual pressure. I plug 92�F and 29.06�Hg into VD to get an accurate SAE correction.
This should help you guys in NM and CO.
Hopefully, VD will have an "Elevation" or "Altitude" input for the SAE correction soon.
Reply
0
0
09-19-2013, 05:00 PM
#236
Former Vendor
iTrader: (31)

Join Date: Nov 2006
Location: Sunnyvale, CA
Posts: 15,442
Total Cats: 2,100
It doesn't work on turbo cars that use EBC that corrects to the same absolute manifold pressure regardless of altitude. If you run a turbo car at sea level and 5000' with the same PSIg levels, SAE corrections will get you within 2% (which is as good as it ever gets with a dyno).
Reply
0
0
09-19-2013, 05:08 PM
#237
So . . .
EBC = Absolute Pressure Controlled (SAE Pressure Correction Not Applicable)
Wastegate Only = Gauge Pressure Controlled (SAE Pressure Correction quasi-Applicable)
But what about temperature. With an intercooler, it seems like this turns into a mess because the intercooler works so much better when it cools off. This is really my dilemna much more than pressure. How to compare a run made in August to a run made in October. Maybe it can't really be done?
Reply
0
0
10-21-2013, 11:46 PM
#238

Love this program!
Here's a couple minor issues/annoyances I've ran into so far. Maybe we can get a fix or maybe someone else knows?
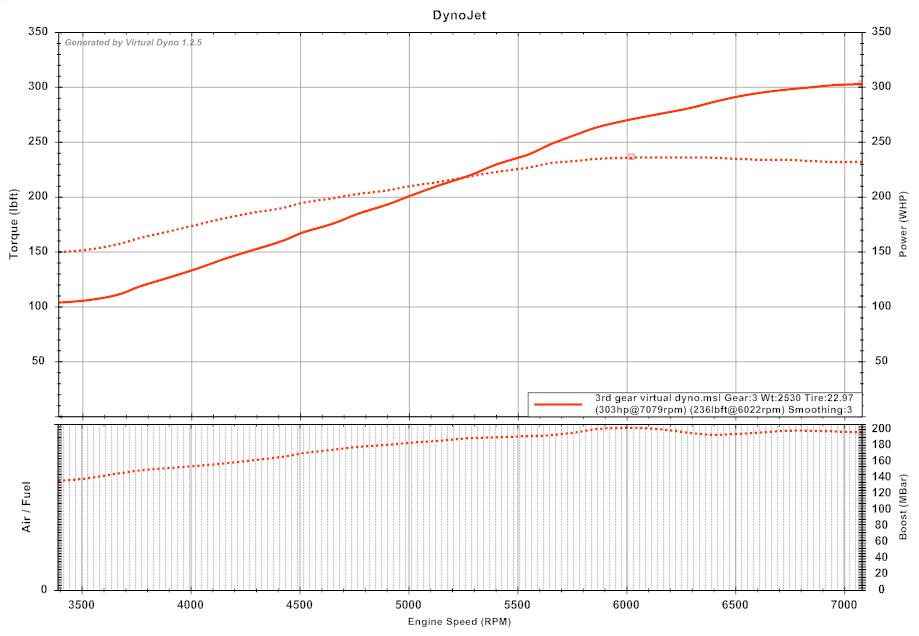
First, is the way boost is displayed at the bottom of the plot. There's an option to not change the units, convert to psi, etc., but none of them work out very well for me.
Pic 1. If left to "no change" it displays kPa, but goes crazy drawing a bunch of gray / minor axis lines... just really clutters it up and doesnt actually help you read the chart.
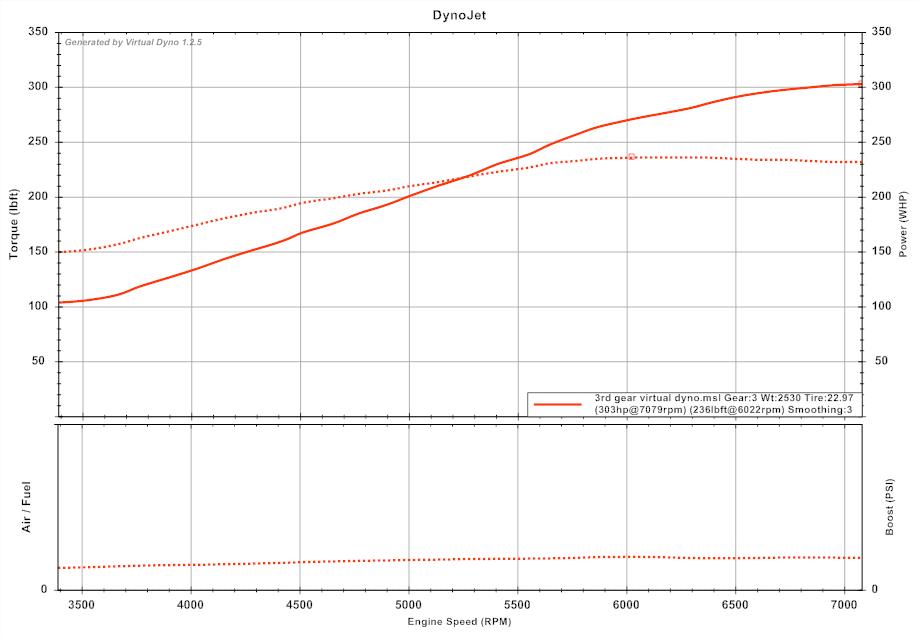
Pic 2. Convert to psi- doesn't scale the Y axis right and does not display a scale.
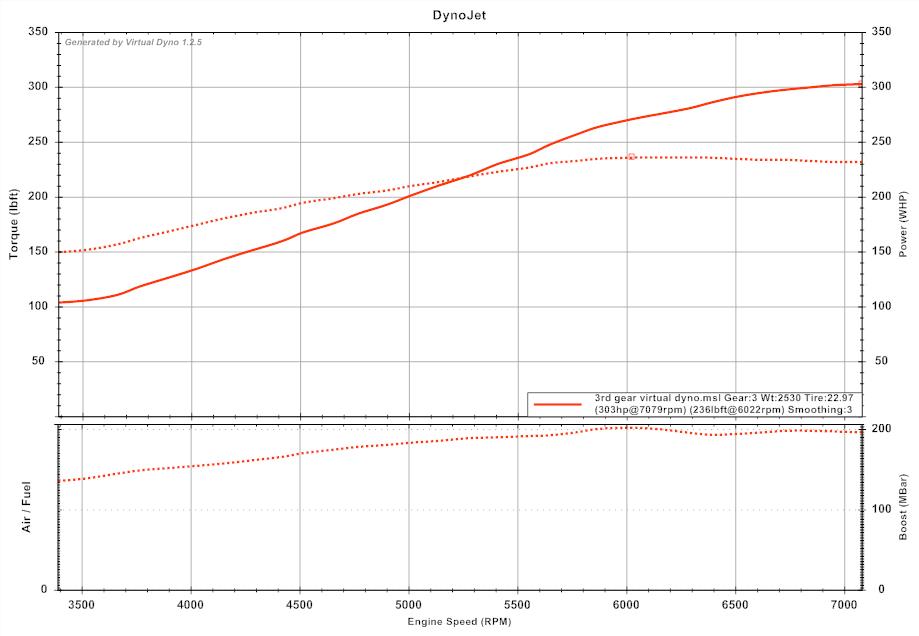
Pic 3. kPa displayed fine again, but again the scale isn't quite right... now it only shows every 100 Kpa.
I see that you can zoom in/out, etc, but either way it seems to me like it's not auto formatting it quite right. On other platforms/tuning tools it seemed to work perfect. If I'm missing something, please correct me!
Other issue I ran into was loading a Megalog viewer-cropped file into the program. I had a super long datalog with a pull in it, so I cropped it out using the megalog feature to "remove all data before this point" and "remove all data after this point", etc and saved a copy. Vdyno would not take it. I tried manually editing out the rows of the original datalog, saving a copy, and Vdyno took it just fine.
Here's a couple minor issues/annoyances I've ran into so far. Maybe we can get a fix or maybe someone else knows?
First, is the way boost is displayed at the bottom of the plot. There's an option to not change the units, convert to psi, etc., but none of them work out very well for me.
Pic 1. If left to "no change" it displays kPa, but goes crazy drawing a bunch of gray / minor axis lines... just really clutters it up and doesnt actually help you read the chart.
Pic 2. Convert to psi- doesn't scale the Y axis right and does not display a scale.
Pic 3. kPa displayed fine again, but again the scale isn't quite right... now it only shows every 100 Kpa.
I see that you can zoom in/out, etc, but either way it seems to me like it's not auto formatting it quite right. On other platforms/tuning tools it seemed to work perfect. If I'm missing something, please correct me!
Other issue I ran into was loading a Megalog viewer-cropped file into the program. I had a super long datalog with a pull in it, so I cropped it out using the megalog feature to "remove all data before this point" and "remove all data after this point", etc and saved a copy. Vdyno would not take it. I tried manually editing out the rows of the original datalog, saving a copy, and Vdyno took it just fine.
Reply
0
0
10-22-2013, 11:54 AM
#239
1. If I want to plot boost in psi, I always insert my own PSI column into the log using Excel. If you know your static pressure (you can get this from the log if you grab your MAP with the engine not turning) then the formula is:
Boost (PSI) = 14.7 * (MAP - Static P) / Static P
If you don't know your static pressure and are near Sea Level, just use 101.2. Should be close enough.
2. Magalog Viewer probably stripped the column names from the file. VD needs these.
Boost (PSI) = 14.7 * (MAP - Static P) / Static P
If you don't know your static pressure and are near Sea Level, just use 101.2. Should be close enough.
2. Magalog Viewer probably stripped the column names from the file. VD needs these.
Reply
0
0
10-22-2013, 01:02 PM
#240
I took a look at the stripped file... Only thing I noticed missing was the firmware info at the top. All of the columns and labels were still there. I submitted the error, maybe something will come of it.
I will give the psi column creation a go. I guess it's not too much work... I don't do the vdynos all that often.
I will give the psi column creation a go. I guess it's not too much work... I don't do the vdynos all that often.
Reply
0
0


