When you click on links to various merchants on this site and make a purchase, this can result in this site earning a commission. Affiliate programs and affiliations include, but are not limited to, the eBay Partner Network.
You're right, I was wrong - thanks for keeping me honest. The AtW curves were mis-labeled and have been corrected.
I'm not posting any plots today, since the changes have been incremental and haven't shown any significant difference. I'll keep on for the next few days and then reset to the baseline and try something else.
Well this is odd. On either my adhere to wall for rpm or map I can't use a fraction of a percent. I am stuck at either a 1 or a 2 where as you were using a 1.2. My sucked from walls were allowing me to use a decimal as opposed to a whole number. Dunno if something is wonky with your numbers or my numbers.
I apologize for the confusion. When I use the Restore Point Difference windows, the curve titles don't show, so when there are multiple curves, it's easy to get them mixed up - which I did. So, to avoid confusion here are all of them properly titled, side by side;
How does the car start with with those settings? Smooth, or does it stumble after first firing? Do you have a video or a log of EAE and pulsewidth at start-up?
First start is good, no stumbles but the cranking time is fairly long - not excessive, but much longer than stock.
I can get a log (and maybe a video) of the EAE & PW at start, later on today.
One note...I haven't been idle these past few days, just haven't made any ground-breaking strides forward. In fact, the incremental changes I've made so far haven't done much of anything. So, last night I made some (relatively) big changes just to see if I'm heading in the right direction (or not).
Pretty nice. I will look at log later. I will have to play with it, but, IIRC, and the reason I asked about this, is that it seems that my EAE during crank is simply the starting pulse divided by the normal pulse called for. The actual EAE calculations don’t seem to operate until engine transitions from Start to Run.
I wonder if if this is a bug in MS3 FW.
EDIT: I don't know. My starting parameters are so much different from yours. It may make sense that my EAE wants to pull so much fuel right after I go to run.
I probably have no more to add on this topic.
EDIT2: It does not make sense that your at rest MAP is 86 kPa in the Atlanta area. It looks like you tuned your car with the MAP sensor uncalibrated.
DNM
Last edited by DNMakinson; 06-30-2019 at 07:12 PM.
Pretty nice. I will look at log later. I will have to play with it, but, IIRC, and the reason I asked about this, is that it seems that my EAE during crank is simply the starting pulse divided by the normal pulse called for. The actual EAE calculations don�t seem to operate until engine transitions from Start to Run.
I wonder if if this is a bug in MS3 FW.
EDIT: I don't know. My starting parameters are so much different from yours. It may make sense that my EAE wants to pull so much fuel right after I go to run.
I probably have no more to add on this topic.
EDIT2: It does not make sense that your at rest MAP is 86 kPa in the Atlanta area. It looks like you tuned your car with the MAP sensor uncalibrated.
DNM
I've been focusing so much attention over the past few months that I've neglected the starting parameters for some time. Maybe that's my next adventure.
Anyway, you're right. I never actually calibrated the MAP sensor - it's been this way since day 1, so I'm leery about monkeying with that now (until I blow this sukka up because I'm overboosting by 14 or so kPa).
So, now I've been trying to see if I could use my strange little "surface plot" to help me target specific areas to try to address. In my last iteration, I was trying to reduce the size of the lean spike after I got out of the throttle between shifts. My thought process was; if I could get enough fuel into the puddle while the MAP is dropping & the RPMs are still up, then the lean spike won't be as big when the throttle plate starts opening. Whether the theory is valid, or not, I raised the AtW in the area of interest (between 3K and 4.5K), and then put in a "dip" in the AtW RPM curve and a bump in the SfW RPM curve in that area of interest and here's what I got;
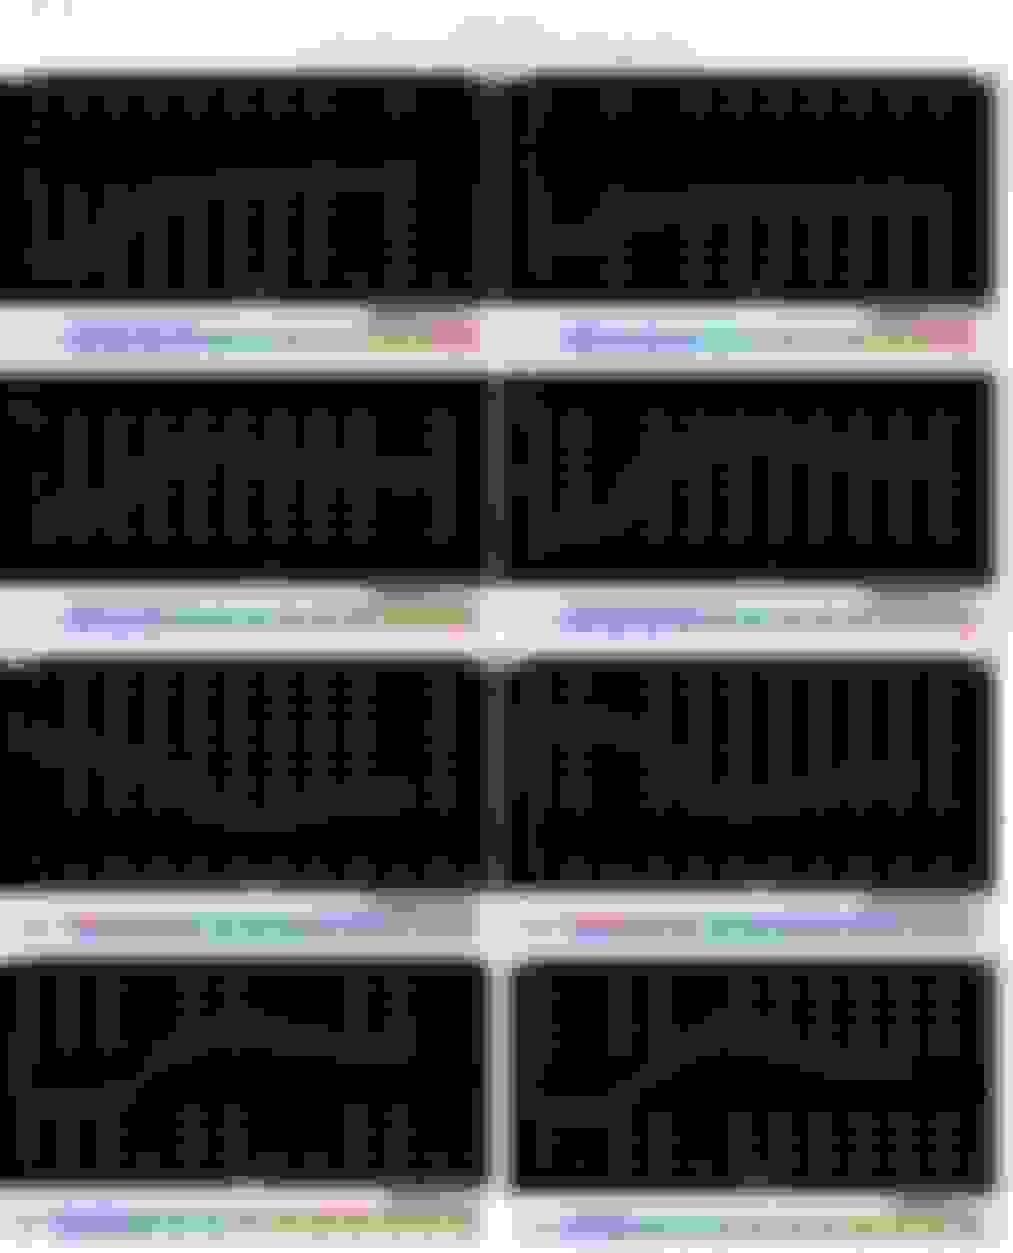
Here's the before (left)/after (right) of my "surface plot" that I used to try to target the area of interest;
I could have done a better job at scaling the two plots so that they can be compared directly, but you can see the "dip" in the right-hand (after) plot. I may be "drinking the Kool Aid" with all of this, but I'm getting results that I wasn't getting before.
I went a little overboard with the SfW RPM curve. So much so that the PW dropped to ZERO in between shifts!! So I'm back-tracking to my 6/29 settings and trying another direction.
I reset my values to those from 6/29 and from there I did a bit more tweaking. But it seemed that I was not making any real progress. Then it occurred to me that (for all of my relatively recent changes) the data from the beginning of the daily logs was better than what was showing at the end of the log. "What could be happening to make it change like that?", I thought. Then It dawned on me - and I'm surprised it took me so long to realize this - the AtW & SfW values are being modified by the CLT curves (dummy!!). The AtW CLT modifier was sloping up, and the SfW CLT modifier was sloping down. So what I did was to take both of those curves where they intersected a "moderate-warm" temp (in this case approx 140*F) and leveled out both of those CLT modification curves, like this;
...and the result was;
Holy crap in a bucket! That was the kind of result I was dreaming about! Not totally flat, but DAMN!!
BTW - here are my other AtW & SfW settings that produced the log;
Of course, not being one to leave well-enough alone, I'm going to first tweak the two CLT curves so that the high-temp "tails" fall at 100%, which means that the respective MAP urve will have to adjust accordingly. My theoretical mind says, "If you move the entire AtW CLT curve up by 6 'points', then the AtW MAP curve must decrease by 6%" (and similar logic for the moving the SfW CLT and MAP curves).
For those that might be wondering, no - I haven't quit...at least not yet. For the past couple of weeks I've been doing all kinds of weird things, trying to tweak my settings into the EAE Hall of Fame. All that I've managed to do is to screw up everything and then go back to my "baseline" time and time again. So, here's where I am currently;
- AtW has been increased above 65 kPa and reduced below that - the thought process behind that is to increase the puddle at higher MAP so that the SfW won't totally deplete it during throttle lifts (and bounce lean because of that). The decrease at lower MAP is intended to reduce the "rich dip" on lifts.
- SfW was modified to push the point where the highest values occur, back towards the range from 65-100 kPa - this is where the throttle lift in between shifts happens during mild street driving. Again, this is to "prep" the puddle for the Big Suck when the throttle shuts during shifts.
- AtW RPM didn't change that much, the major modification was to taper the lower RPM values into the dip around 4K, instead of having a plateau at idle RPMs. I might change that because that could be destabilizing my idle...we'll see.
- SfW RPM was reduced at higher RPMs and the "peak" is around 4K.
Here's the curves...and the result
I still can't get over how damned consistent the data is from days apart.
 06-27-2019, 07:17 PM


 0
0