When you click on links to various merchants on this site and make a purchase, this can result in this site earning a commission. Affiliate programs and affiliations include, but are not limited to, the eBay Partner Network.
Dude, if you really want to go this deep, which is cool, get the MS3. It is vastly superior once you get to detailed fueling. When you eventually get one, you will be like "jeez, wish I had done this earlier".
Right now, it's a matter of economics. I blew up my engine last year (actually, I cracked 2 pistons), right before "Miatas Before The Gap". Then the oil seals on my churbo went out a few months ago. So I'm recovering financially from all of that. Ideally, I'd get a MS3 Pro, but none of that is on the horizon, so I have to suffer through all of the limitations of the MS2. Yeah, it's a PITA but when I DO get the Pro, it'll be like having a pet unicorn in my garage! Or, as some might say, I'm "building character" now.
Basically, I increased SfW MAP values slightly from 65kPa, out through 220 Pa, the increase is very slight. More importantly, I think, is that I increased the SfW RPM curve after 3000 RPM. I made those changes to see if I would influence the rich dip after a throttle lift in between shifts, ad it looks like that's exactly what happened. The dip is less rich - not by a lot - but it seems to be heading in the right direction. I'm changing a little bit at a time ad comparing it to the 6/12 baseline as a reference point.
Just letting y'all know that I'm not done with this puppy yet!
BTW - a few days ago I lost the little "tracer" on the VE Table in the Graphing & Logging tab in TunerStudio (you know, the little blue dots that show where you are in the table relative to where the cursor is in the graph). I don't know what I did, but it's gone. It's still there in MegaLogViewer, but not in TunerStudio.
This isn't an end of the world scenario, but it's nice to have. I anyone knows how to resurrect that tracer, I'd appreciate it.
I'm slowly closing in on EAE nirvana. My latest comparison to baseline;
The scaling is different than the other logs, but the effect is (I think) fairly obvious. The rich dip is less (but still in the 12's) and the lean spike is significantly less. Drivability is excellent with the return to idle being crisp and without any sags, and there are no stumbles anywhere. This latest "victory" was achieved by lowering the AtW MAP curve slightly around the area where the MAP "knees-over" in a throttle lift during normal cruise (between 65-90 kPa).
I'm going to give that area another tweak and see what transpires. Other than that, my next area of interest is to fine-tune the RPM curves.
Yesterday, instead of only targeting the area in the AtW MAP curve like I said I would, I decided to decrease the entire curve by 2 "points" - you know, the "if some is good, more is better" theory. And, like usual, that theory backfired. I didn't make things worse, but I didn't make anything better, so I think I've reached the point of diminishing returns with AtW.
Next step; back out this last AtW MAP change and do some "analysis" of the RPM impacts. I'm going to find some instances in a log where the MAP is the same, but the RPM is different and then adjust the corresponding RPM curve accordingly. This'll be fun!
The quest continues. I've backed out the AtW MAP changes, and bumped up the SfW MAP values between 55 & 80 kPa with some "interesting" effects. What I was expecting to see is the rich dip after lift to bump up a tad (i.e. go somewhat leaner). What (I think) I'm seeing is the lean peak drop a little! I say "I think" is because in some places, the effect seems considerable, and in other places it's not significant. This warrants some further inspection.
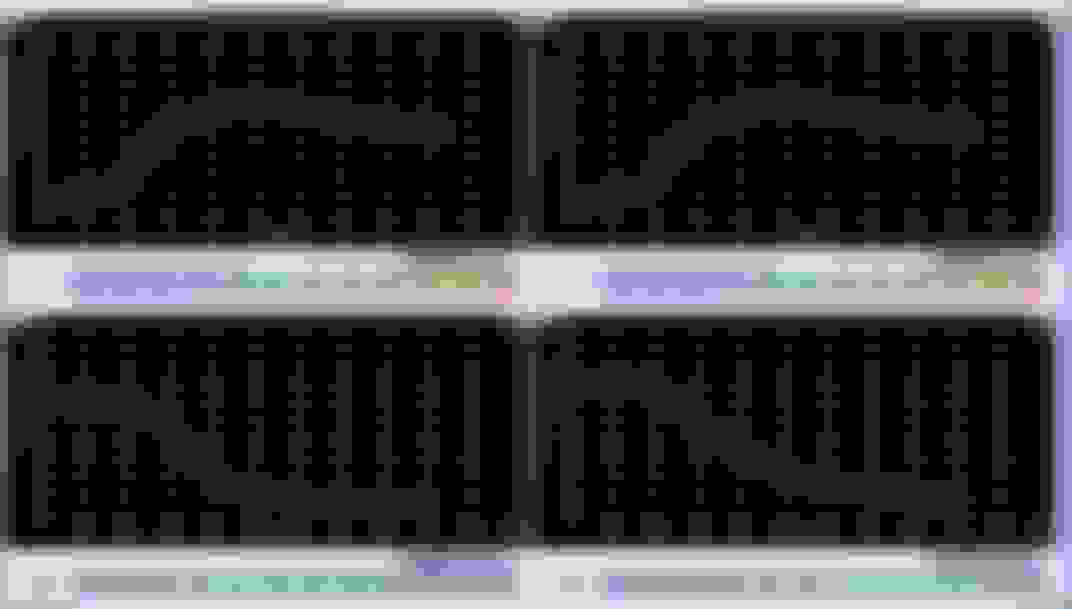
Anyway, here's the data. The differences between the 6/17 "baseline", and this morning's AtW (top, cut off), and SfW (bottom) MAP curves
...and the log;
You can see in the first transient, the lean peak is much lower in today's run. Whereas, in the second transient, the peak is practically the same. I'm wondering if the "RPM effect" is that sensitive? The peak RPM on the second transient today is within 200 of the one yesterday - that's about 5% of the total. Is it THAT "touchy"? If so, that's going to make adjusting for RPMs very tricky.
As a point of reference, my RPM curves have ~5x more "weight" than the MAP curves.
10-4 Ted!
Things are getting "interesting"...before I show the data, let me explain some of the reasoning behind the changes. First, with the RPM seemingly being a more predominant factor, I've decided to concentrate my efforts around the 3500-5000 RPM range - where most of my between-shift lifts are happening. To do that I have to "sacrifice" the low and high ends of the table in order to concentrate more points in the middle. So I've re-done the RPM scale to address that. Next, I shifted the "bump" in the curve towards the 3500-4500 RPM range so that I can get more effect there. This first attempt was just to see if I could make those changes without screwing up the AFRs that I've worked so hard to achieve in between shifts.
Here are the results;
...and...
The "inter-shift" dips and peaks are slightly worse (i.e. the rich dips are richer and the lean peaks are leaner - but not tragically so). Now comes some fine-tuning.
hey gents help me out with the math on this. It'll help me visualize what is going on.
Is the EAE1 multiplying the PW or adding to it? What confuses me is, why aren't these graphs centered around 100%? And if not, why wouldn't the various graphs go negative?
Or, is the EAE1 a correction/modifier to the Acceleration Enhancement graph?
PW = PWbase + AE*EAE1?
And Wall Fuel. That appears to be time varying amount. Is that used for the fueling equation or is that just giving you a frame of reference for how much fuel is on the wall?
EAE is a percentage applied after all corrections, but prior to deadtime.
Adhere coefficients apply to the amount that is added to the walls, and thus not injected into the engine. An Adhere of 0 implies all of the fuel goes to the engine, an adhere of 100 implies it all goes to the wall. The product of all adhere coefficients is limited in the code to 100%. All added fuel is accounted for with the running integrator Wall Fuel. Wall Fuel has units of pw, or time. I added 200usec of my 2msec pulse to the wall with a 10% adhere coefficient. The wall now has 200usec more fuel.
Sucked is the percentage of the total wall fuel that is available for a given pulse. If I have 10000usec of wallfuel, and a 10% sucked, I pull 1msec of fuel off the wall. I now have 9000usec of wallfuel, 1000usec of additional injected pulse.
The actual pulse is the corrected pulse plus the added minus the sucked. So for the above example, a 2msec pulse adds 200usec to the wall, pulls 1000usec from the wall. 2000 + 200 - 1000 = 1200. 1200/2000 = 0.6 (60%) so EAE will PULL fuel with a 60% multiplier because there is a bunch of fuel coming from the wall.
Now with the same base pw of 2msec, but an adhere of 50 and a sucked of 10 I would get 2000 + 1000 - 1000 = 2000, EAE = 100%
Or with adhere of 75 ... 2000 + 1500 - 1000 = 2500 - EAE = 125%
Last edited by Ted75zcar; Jun 22, 2019 at 10:46 AM.
Ted, I'm glad you answered that because I couldn't. I'm going to read this description about 10 more times, and then, maybe, some of it might seep in. Frankly, I've tried to make sense of the EAE% and WF curves for a long time. The only thing I "knew" was that big troughs in WF were "bad", and that EAE% roughly mirrored PW (pretty elementary stuff).
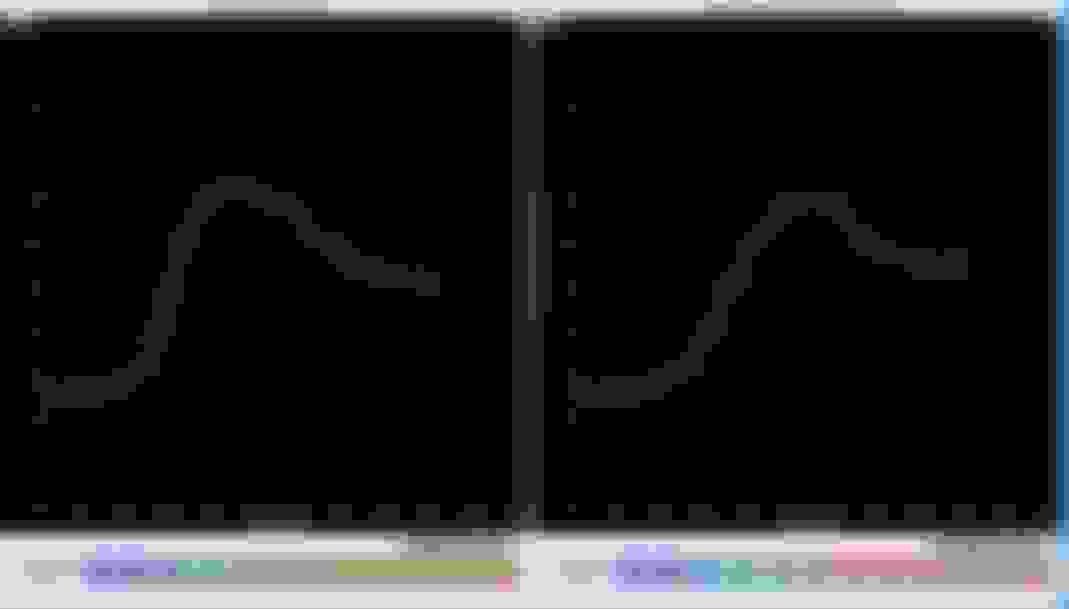
Until it does. here's my latest feeble attempt. I took the old AtW curve (right) and smoothed it out, lifting the points between 3000 & 4500 RPM out of that abrupt transition. My thought process was that maybe this would add enough fuel just before the throttle lifts in that area to keep the AFRs from going as lean as they do.
The difference;
...and the result;
To the left and right of the cursor position, I think it's working. Although further left, at the 1-2 shift, I'm going to attribute the LACK of difference to the RPM difference between the before/after traces. All in all, I think the results are showing a positive trend.
Ok, I'm going to share this..."For Science"!! I have no idea if it's useful, or significant, in any way but I'm sharing it in case anyone has a better idea. So here goes...
In manipulating all of the SfW & AtW curves I got to wondering whether I was causing the MS to do something stupid. So I decided to see what the combined effect of all of the curves was doing to to overall suck/add percentage (and now that I think about it, I think I made a fundamental error, but more on that later). So I took the AtW MAP curve as the "x" value, and the AtW RPM curve as the "y" value and then multiplied the cross-product of the cell values as the "z" coordinate and then plotted that in Excel as a 3D surface plot that describes the AtW percentage as a function of MAP & RPM. Then I did the same for the SfW curves. Finally, I subtracted the SfW surface values from the AtW values (this is my fundamental flaw because the SfW values are sucked from the wall values - based on the AtW values - so, what I SHOULD have done was AtW - (AtW * SfW), instead of AtW - SfW).
Anyway, this is what my (faulty) 3D plot looks like;
It's kind of hard to see, but the gist of this is that the calculated "raw percentage" drops slightly from 0 to 7500 RPM, and increases dramatically from 0 to 220 kPa. Also, the value plateaus between 45 & 46 kPa.
I'm going to see if this tool helps me in any way to try to address some of the things that I see in the datalogs. Who knows?
My latest changes have brought me back full-circle - back to my 6/20 baseline [sad face]. That's the thing that I think drives people insane when dealing with EAE - you make changes, expecting something wonderful and end up with a mess, or back where you started from. Anyway...
In order to support using my "tool" I had to make some changes to the RPM axes on the AfW & AtW curves so that they would be the same. Doing that screwed up the curves, so I had to do some "creative editing" to make them match. My first attempt made matters worse - and I'm not publishing that failure. My second attempt this afternoon was better - to wit;
That's as close to identical as I think I could get. The curve changes necessary to achieve that were;
AtW RPM (not MAP), top - and AtW MAP (not RPM), bottom and...
SfW RPM - where the most significant changes were made. If you notice, in the old settings (left), the peak correction was in the 4250 & 4600 RPM cells. In the new settings, the peak value is in the 3575 and 3900 RPM cells. Don't ask why that was necessary because I don't know!
More experiments tomorrow!
Last edited by rwyatt365; Jun 27, 2019 at 08:20 AM.
Reason: Curves mis-labeled
Maybe I am doing something wrong buy my adhere to wall coefficient based on map is in % and I cannot use a fraction of a number. I am stuck with whole numbers like this. Am I doing something wrong compared to you? I was modifying my tables a bit to see how they worked with some of your testing.
Maybe I am doing something wrong buy my adhere to wall coefficient based on map is in % and I cannot use a fraction of a number. I am stuck with whole numbers like this. Am I doing something wrong compared to you? I was modifying my tables a bit to see how they worked with some of your testing.
I am running a ms3pnppro.
You're right, I was wrong - thanks for keeping me honest. The AtW curves were mis-labeled and have been corrected.
I'm not posting any plots today, since the changes have been incremental and haven't shown any significant difference. I'll keep on for the next few days and then reset to the baseline and try something else.


 0
0