
Let's discuss VE Tables.

Thread Starter

Joined: Sep 2005
Posts: 34,424
Total Cats: 7,547
From: Chicago. (The less-murder part.)
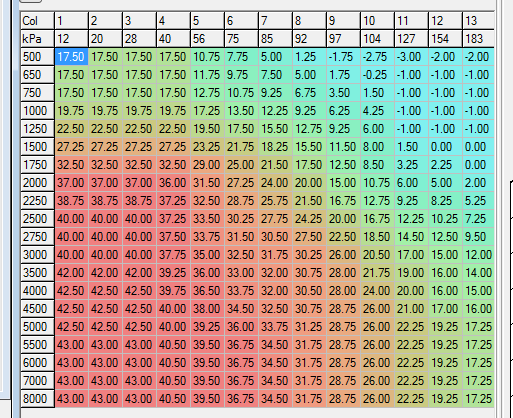
Am I the only one who has found it necessary to add some range to the bottom of the VE table? It seems as though nearly every other VE table I've seen posted had 20 kPa as the bottom row.
Don't mind the exact values in the bottom three rows- they were only just created today and are still very rough. But I'm already seeing a massive improvement in mixture stability. Used to be that operating down in this range would drive the gEGO into weird extremes which it would then have to wind out of as soon as I got on the throttle. Lots of tip-in leanness as a result. This way, I can have valid cells all the way to the lowest possible operating value, with the result that gEGO can remain in a fairly neutral position at all times.
"Yes," I can hear you say, "but you're sacrificing resolution at the top end."
True, but it really doesn't matter. Sure this particular car is N/A, but I've left room enough for boost. The upper rows are blacked oput because they're untuned and contain completely bogus data right now, but I could easily re-scale and tune them to accommodate any reasonable amount of boost.
Unlike the region from 15-30 kPa, the rest of the table is pretty damned linear in the MAP axis. You could go all the way from 100 kPa to 250 kPa with only three or four rows and just let the ECU interpolate. Back when we were all using 8x8 tables, it wasn't the top end that was a problem, it was the bottom. (Hell, the old Link ECUs only had six MAP rows.) So I'm not sure why more people are not taking advantage of the extra resolution down in the area where it can do the most good.
Reply
 0
0

0

Just to ask ignorant questions (the autotuning sessions I make is less than scientific to say the least):
Is there any way to analyze the percentage of cell usage while autotuning, to figure out where you would benefit from extra resolution (and then analyze the linearity of the table afterwards)?
Since I don't tune for a DD and don't tune on track (then there is a number of other tings to concentrate on) I feel that i spend very little time in the 40-70 kpa range.
There is the color map for the cell changes in AutoTune, but is there a cell occupancy frequency view?
To really embarrass myself, it was close to two years since I had the MS up and running (the spare engine have been running on a Mazda ECU), so Autotune might have developed a lot.
But there are maybe enough rows available to not care about it.
Have you performed the same analysis on the rpm range?
There is probably more than one statistical method for finding nonlinear data (outliers etc), but I choose to not google it now.
Reply
0
0

Elite Member
Joined: Mar 2006
Posts: 1,574
Total Cats: 106
From: Schwarzenberg, Germany
Hi Joe,
you can even extend the VEtable more to your needs be simply using table switching depending on kPa. You use VEtable 1 and Vetable3 then and get 16x32 resolution...
When using Autotune you have to start tuning on both tables, but apart from that it works fine...
you can even extend the VEtable more to your needs be simply using table switching depending on kPa. You use VEtable 1 and Vetable3 then and get 16x32 resolution...
When using Autotune you have to start tuning on both tables, but apart from that it works fine...
Reply
0
0

Junior Member
Joined: Jan 2009
Posts: 142
Total Cats: 6
What we used to do was waste an evening running through the entire rev range on a dyno with 100rpm increments and map the VE curve. Youth and free access to dyno time will do that to you.
What you could do is just shift all the rpm setpoints by a certain increment and then autotune again, keeping in mind which area's were adjusted most. You can repeat that a couple of times.
The underlying idea of it all is that there are several VE influencing events going on in an engine. The biggest one is the relationship between rpm, head-flow and cams. Beside that there are several harmonics going on from runners manifolds etc. As the big VE influencer becomes smaller in extent, the harmonics start to have a bigger relative influence. So at lower rpms and VE, a harmonic might cause jumps of up to 50%. At higher VE and RPM, the same harmonic might be just a 0.5% delta to the total VE.
Reply
0
0
(for me) To be able to figure out where in the table I can find the non linear areas it would help if I could see where in the table I've been (i.e the autotune have some confidence).
If the area is "not linear" it might benefit from "zooming in" and autotune that area some more.
Oh, well a linear table is most probably good enough for me (and when I get the trottles on there the MAP will not be that important anyway).
If it's not I have to figure out it for myself, noone run an engine identical to mine anyway.
Reply
0
0
Supporting Vendor


Joined: Feb 2013
Posts: 63
Total Cats: 7
This is pretty awesome. I have a different EMS on my rx7, but i still throw a lot of resolution down in the bottom end of the map. Helps out a lot.
__________________
Peter - DIYAutoTune Tech Support
DIYAutoTune.com
We manufacture the most affordable high end engine management available anywhere, and we do it right here in the USA!
MegaSquirtPNP Gen2- 1 hour install Plug-N-Play for Miata's
-
MegaSquirt-3 Pro EMS - Top of the line ECU at an affordable price.
Peter - DIYAutoTune Tech Support
DIYAutoTune.com
We manufacture the most affordable high end engine management available anywhere, and we do it right here in the USA!
MegaSquirtPNP Gen2- 1 hour install Plug-N-Play for Miata's
-
MegaSquirt-3 Pro EMS - Top of the line ECU at an affordable price.
Reply
0
0
Joe,
Have you seen the idle specific VE table under Startup/Idle > Idle VE Settings?
Also to note, I think we're seeing lower absolute pressure readings with the newer ECU's. Engines are running more efficiently due to the combination of sequential fuel, more precise injection event angle, more precise injection event duration, map sample windowing, and increased spark timing accuracy.
Reply
0
0

I dont see the need for many boosted rows, mine stops at 20kPa, because I dunno, that's where I set it up. But I barely ever pull more than 18-15kPa in the heaviest of vacuum pulls, so there's no fueling going on then.
But I will say, that 20kPa row always seems to be victim of odd VEAL tuning when in cruise, so maybe it would benefit from at least another row below it to help. It's been a while since I lasted tuned, but I remember it always wanting to pull fuel from that row and then leaving me with a lean condition, so I've always used a kPA filter on VEAL to never allow it to tune under 35kPa or something like that.
But I will say, that 20kPa row always seems to be victim of odd VEAL tuning when in cruise, so maybe it would benefit from at least another row below it to help. It's been a while since I lasted tuned, but I remember it always wanting to pull fuel from that row and then leaving me with a lean condition, so I've always used a kPA filter on VEAL to never allow it to tune under 35kPa or something like that.
Reply
0
0
Joined: Jun 2005
Posts: 19,338
Total Cats: 574
From: Fake Virginia
y8s has been using the 10kPa table row since before it was cool.

edit:
The reason the idle VE table is insufficient is because it doesn't handle light cruise or coastdown.
edit:
The reason the idle VE table is insufficient is because it doesn't handle light cruise or coastdown.
Reply
0
0
Thread Starter
Joined: Sep 2005
Posts: 34,424
Total Cats: 7,547
From: Chicago. (The less-murder part.)
When you're coasting along with your foot barely on the throttle, you spend a fair amount of time below 20. And for whatever reason, the engine seems to get real non-linear in that range.
Reply
0
0

Reply
0
0

Newb
Joined: Oct 2010
Posts: 3
Total Cats: 0
From: Alberta Canada
I have been having the same issues as described and have been thinking of adding more resolution to my VE tables on the low end of MAP. I will be doing this for sure now, and I am interested in any results you find.
Reply
0
0


Reply
0
0


