

Acceleration curve vs torque curve vs HP curve.


Thread Starter
Elite Member
Joined: Apr 2010
Posts: 2,826
Total Cats: 66
From: Newcastle, Australia
That can only be important if it needs to know ground speed, which isnt important unless its used for drag calcs, for proof notice that cars on a dyno have zero groundspeed.
Reply
 0
0

0
I have no idea what you're saying but it needs the gear used and tire diameter every time or it wont even spit out the plot for you.
And if you put in the wrong one, it will skew results by 100-200hp
And if you put in the wrong one, it will skew results by 100-200hp
Reply
0
0

. . . you'll understand what I'm saying. Dynojets don't need to know RPM to generate an accurate power curve, and they never ask for tire diameter or gear ratios at all. They measure raw power based on the time it takes to accelerate a known mass (the drum), then use RPM to back-calculate torque output from there.
So, just like Andrew's Dynojet example, VD is taking a little bit of information and deriving a whole bunch from basic physics. Both examples are pretty cool I think.
Reply
0
0
Thread Starter
Elite Member
Joined: Apr 2010
Posts: 2,826
Total Cats: 66
From: Newcastle, Australia
Yeah, I get it. Two different ways to calculate based upon the inputs available.
Actually, VD is using the gearing and wheel diameter applied to the RPM to get the speed . . . and then comparing that to time to get the acceleration. It also uses speed and the input Cd to put in a drag factor. It only looks to our MS logs for RPM and time.
So, just like Andrew's Dynojet example, VD is taking a little bit of information and deriving a whole bunch from basic physics. Both examples are pretty cool I think.
Reply
0
0
Xactly! Aaannd, this is also why it is so important to control things like road slope, road surface, tire pressure, wind, etc. when using VD. All of those things affect the "load."
Compare that to an actual dyno where the inertia of the roller or the resistance from an Eddy brake are nice and consistent run after run.
Sorry for rambling. I like physics and just came off a track weekend so I'm a bit amped-up and having a hard time getting back to real work.
Compare that to an actual dyno where the inertia of the roller or the resistance from an Eddy brake are nice and consistent run after run.
Sorry for rambling. I like physics and just came off a track weekend so I'm a bit amped-up and having a hard time getting back to real work.
Reply
0
0
So, I took on the challenge. I grabbed one of my old VD pull datalogs from the Red car (MSPNP1) and modified it as follows:
1. Opened it in Excel.
2. Added a "Delta RPM" column that calculates the RPM difference between each row of data. I'm using RPM as a proxy for speed since the pull is in a single gear.
3. Added a "Delta Time" column that calculates the time difference between each row of data.
4. Added an "RPM/s" column that is "Delta RPM"/"Delta Time."
5. When I graphed "RPM/s," I found the result to be noisy (I'll bet data from a second or third generation MS would be a lot better). So I added a "Smooth RPM/s" column that is just "RPM/s" going through a single-pole filter with an adjustable filter constant. A filter constant of 20 gave a pretty viewable line.
6. I then saved the spreadsheet as a text file for VD.
I opened the text file in VD and then told VD that "Smooth RPM/s" was my boost so it would plot that line on the same graph as torque and HP. This is the result:
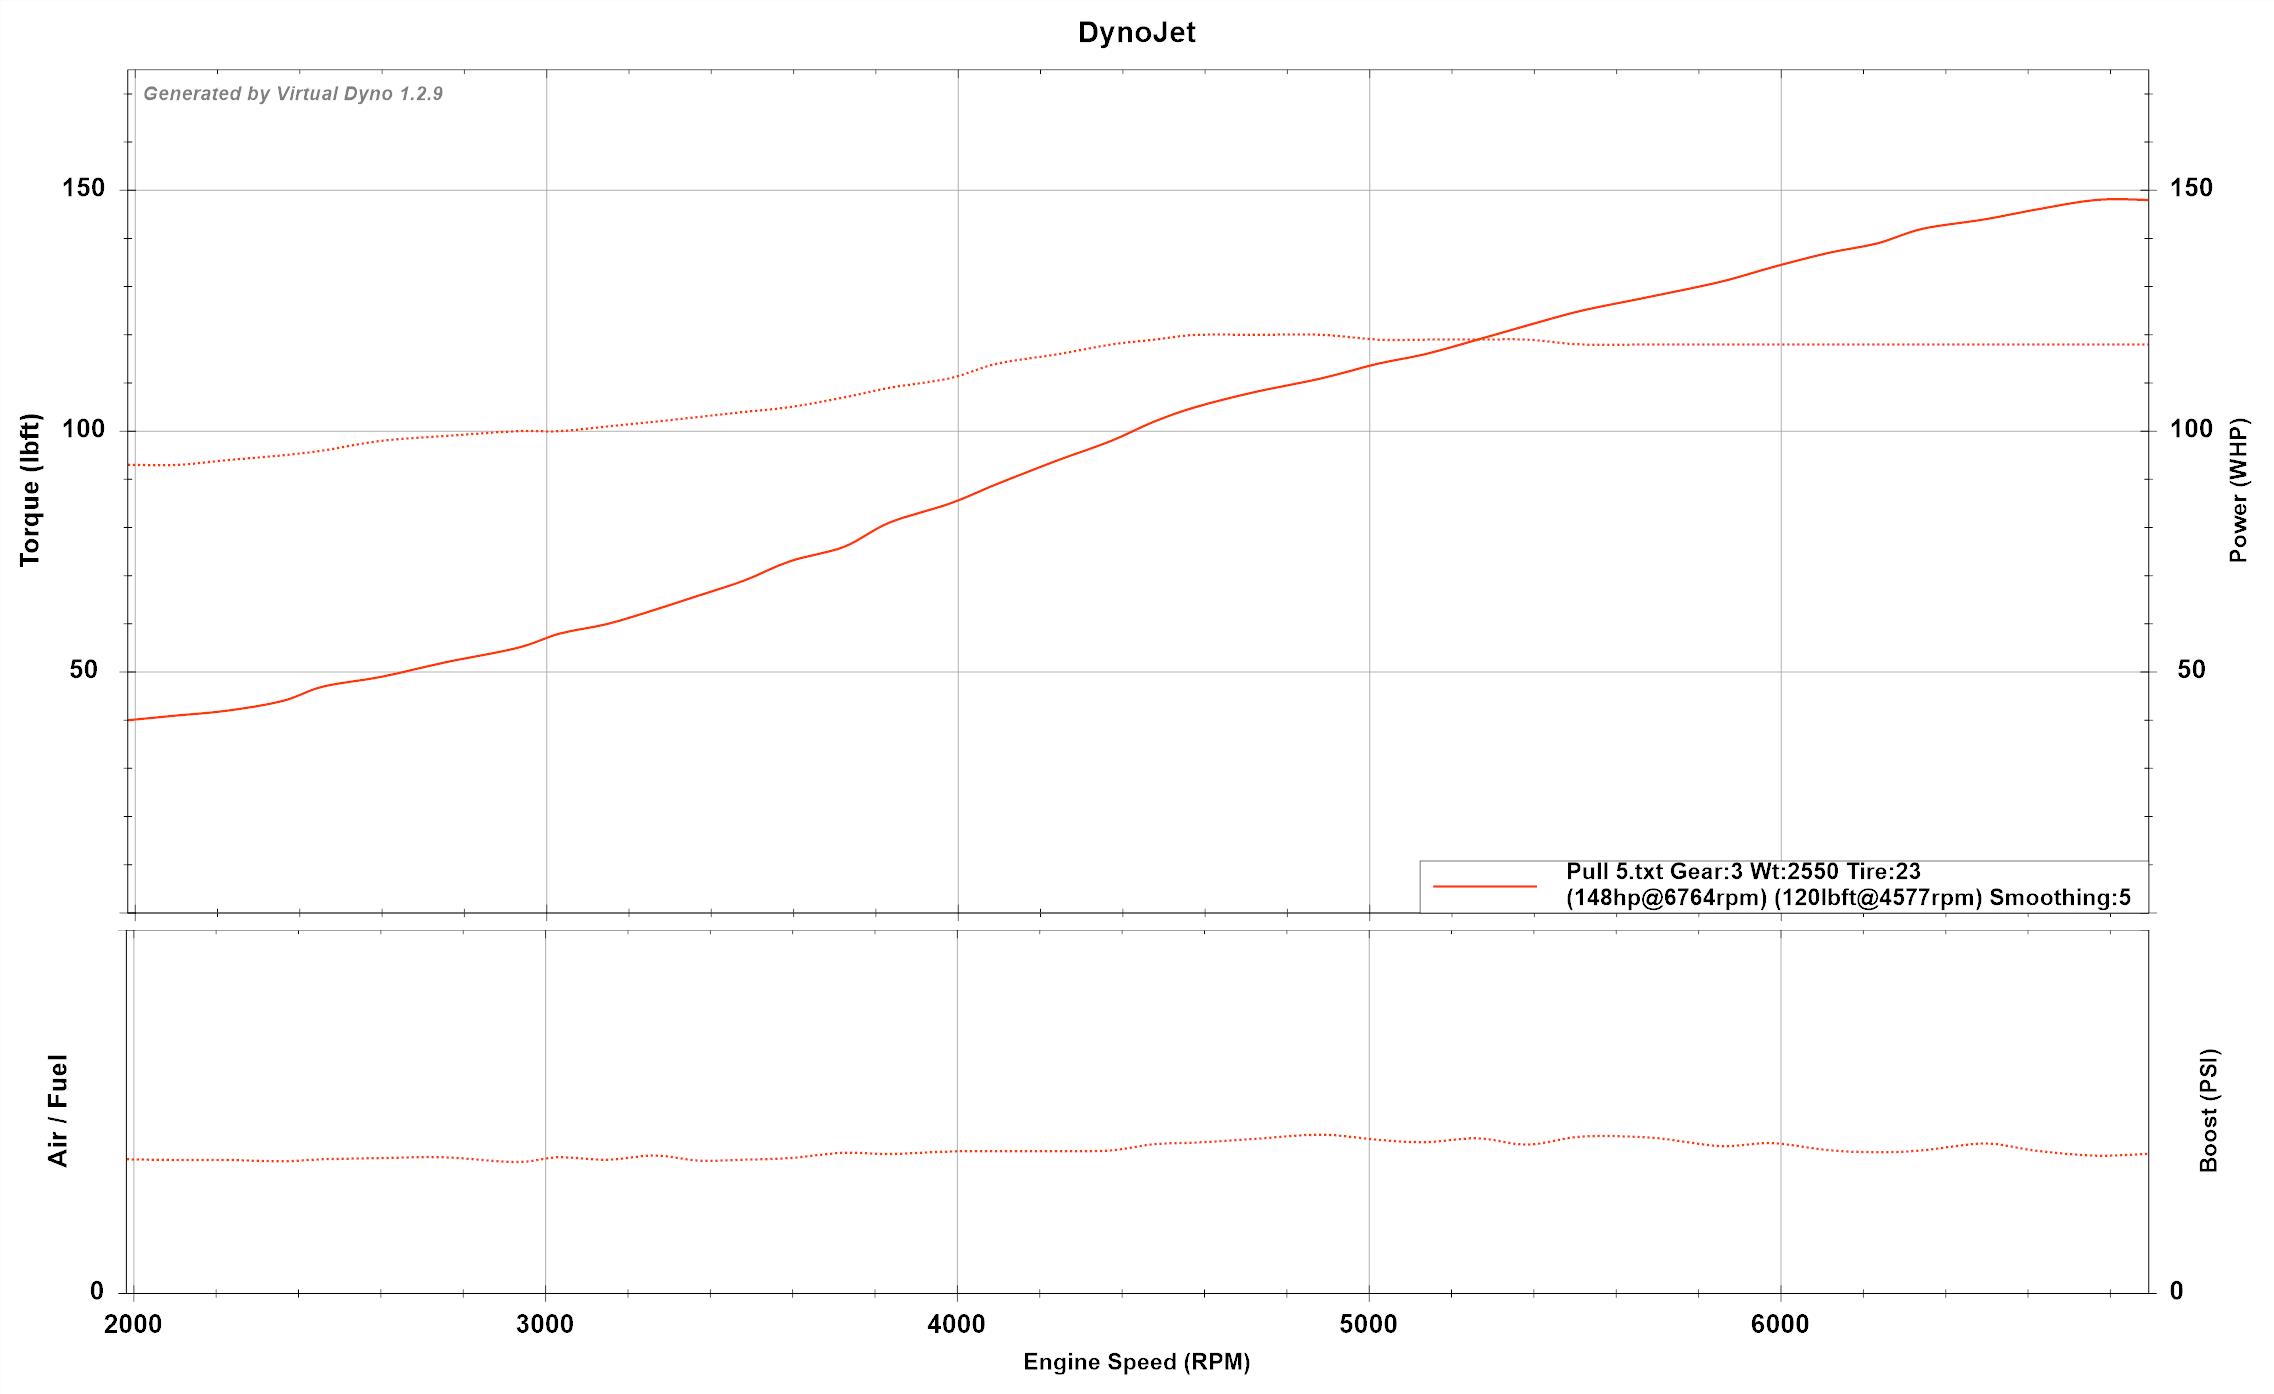
You can draw your own conclusions. Spreadsheet and VD text file also attached. Vlad, you could do this with some of your data too.
1. Opened it in Excel.
2. Added a "Delta RPM" column that calculates the RPM difference between each row of data. I'm using RPM as a proxy for speed since the pull is in a single gear.
3. Added a "Delta Time" column that calculates the time difference between each row of data.
4. Added an "RPM/s" column that is "Delta RPM"/"Delta Time."
5. When I graphed "RPM/s," I found the result to be noisy (I'll bet data from a second or third generation MS would be a lot better). So I added a "Smooth RPM/s" column that is just "RPM/s" going through a single-pole filter with an adjustable filter constant. A filter constant of 20 gave a pretty viewable line.
6. I then saved the spreadsheet as a text file for VD.
I opened the text file in VD and then told VD that "Smooth RPM/s" was my boost so it would plot that line on the same graph as torque and HP. This is the result:
You can draw your own conclusions. Spreadsheet and VD text file also attached. Vlad, you could do this with some of your data too.
Reply
0
0
Thread Starter
Elite Member
Joined: Apr 2010
Posts: 2,826
Total Cats: 66
From: Newcastle, Australia
Thank-you.
So far that's close but both curves are pretty flat, data with an obvious knee point would be better.
If I sent a datalog of a dyno run and a street pull on a car with a lumpy torque curve would you easily be able to do the same?
So far that's close but both curves are pretty flat, data with an obvious knee point would be better.
If I sent a datalog of a dyno run and a street pull on a car with a lumpy torque curve would you easily be able to do the same?
Reply
0
0


Putting the charts together and expecting them to relate to each other is never going to work, BTW. You're taking one chart (acceleration) which naturally factors in aerodynamic drag, and trying to relate it in some fashion to a chart that doesn't factor in aerodynamic drag.
Reply
0
0
Reply
0
0
I would think so. Don't you have Excel?
Reply
0
0
Thread Starter
Elite Member
Joined: Apr 2010
Posts: 2,826
Total Cats: 66
From: Newcastle, Australia
Putting the charts together and expecting them to relate to each other is never going to work, BTW. You're taking one chart (acceleration) which naturally factors in aerodynamic drag, and trying to relate it in some fashion to a chart that doesn't factor in aerodynamic drag.
With a Turbo car I can move the torque knee with ease and repeat.
To answer regarding excel I can't use it well enough but my house mate can. I'll ask him.
Reply
0
0
Can someone upload an excel pull that has speed and time?
Also can someone plot it on virtual dyno, at last, what weight did you use for the car when plotting it?
I'll calculate the acceleration and graph it.
Also can someone plot it on virtual dyno, at last, what weight did you use for the car when plotting it?
I'll calculate the acceleration and graph it.
Reply
0
0
That's what I did above. So long as you stay in a single gear, RPM ~ speed. To convert RPM to speed, you just multiply by a constant consisting of gear ratio, axle ratio and tire diameter. The curve shapes will be identical.
Reply
0
0
In theory, yes. In practice, I've spent lots and lots of time comparing RPM-calculated "speed" to GPS-verified speed, and they never, ever match. At high speed, the difference is substantial (5%+). RPM-calculated speed always overestimates actual ground speed. My hypothesis is deformation of the tire at high speed.
Reply
0
0


