When you click on links to various merchants on this site and make a purchase, this can result in this site earning a commission. Affiliate programs and affiliations include, but are not limited to, the eBay Partner Network.
How tire size, transmission gearing, final drive gearing, and your specific dyno curve relate can be a tricky thing to understand when it comes to questions like "what should my shift points be?", "how many gears should I downshift at a given corner?", and "what final drive gearset is best for me given I'm now gearing out after doubling my power and/or adding extra rpm to my rev limit with a turbo and/or engine swap?"
Thankfully, there are slightly more advanced ways in helping understand this, and the way you do that is by calculating your vehicle's tractive force by gear. Tractive force is essentially the pushing force that you are exerting at the tire which propels the car forward. For the fastest lap time, you'd want to maximize the tractive force to the tire and minimize the number of times shifting. You may find that (depending on your power curve) the force in 3rd is close to the force at the same speed in 4th where you'd possibly be better off in 4th to save additional shift time (as one example)
A helpful example of this can be seen in a recent post that I made. The very meaty low end torque curve of the K24 Turbo powertrain, coupled with the cars short gearing (6spd/4.3), showed that revving out past 7500rpm would actually make him slower and in some cases shifting at 6500rpm could be a benefit. This accurately correlates back to accidental data the driver had that showed spending more time in the lower region of the powerband was actually faster. Calculator In Use
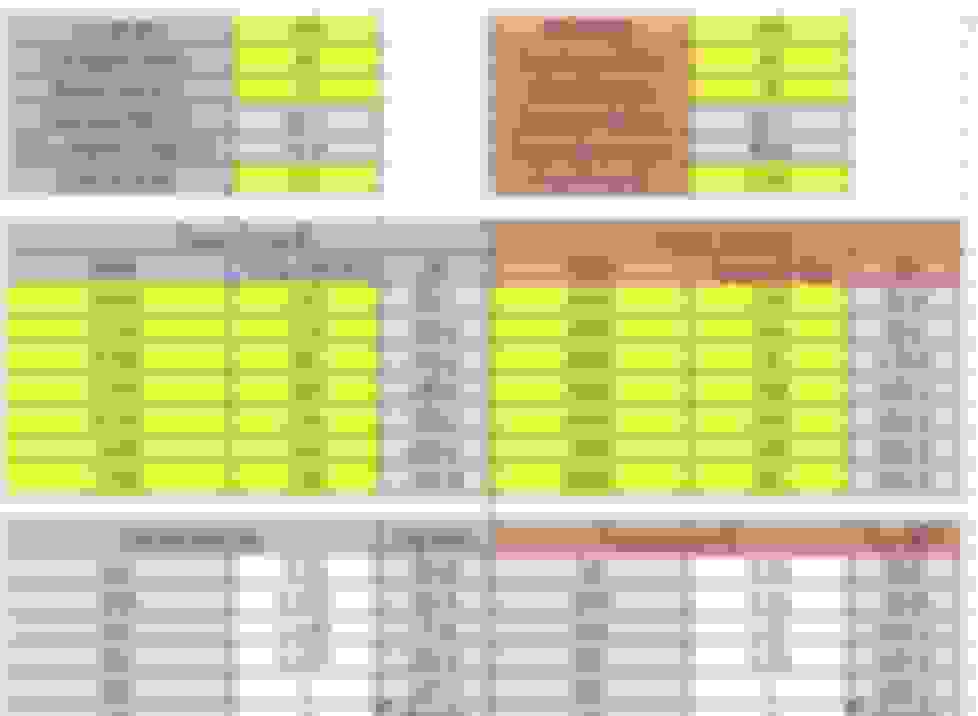
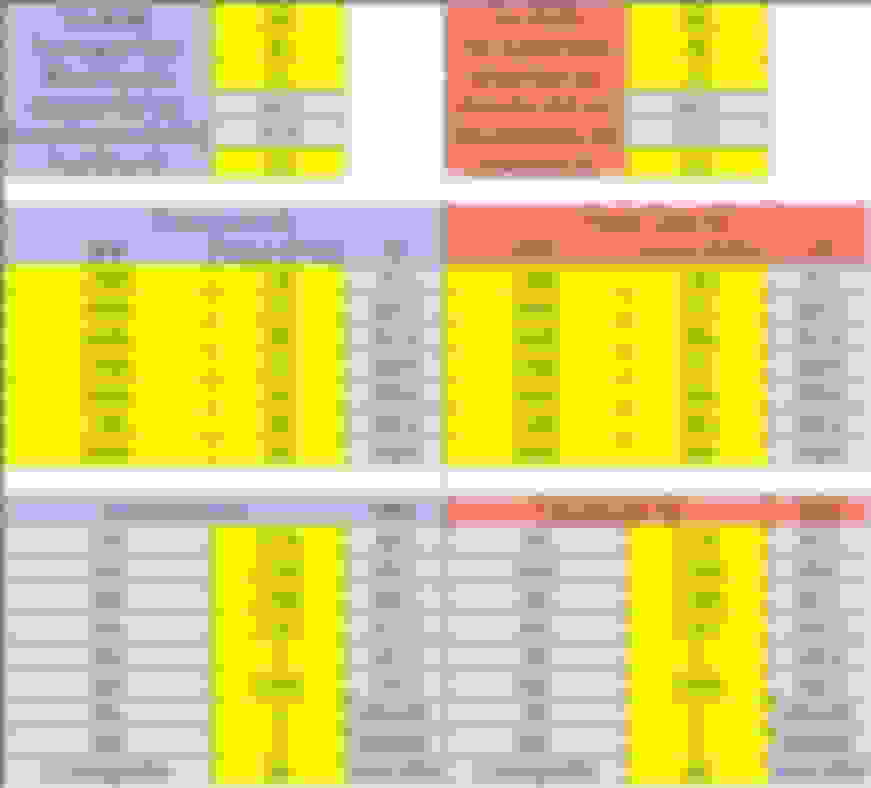
I wanted to walk through how to use what I've made.The spreadsheet has the capability to compare tire size, wheel size, final rear gear drive ratio, transmission ratio, rev limit, power/tq curve changes, and cruising RPM while in top gear at a given speed all independent of one another. The sheet works with the following inputs.
Blue cells correlate to Powertrain #1 (which relates to the blue tractive force curves you will see shortly)
Red cells correlate to Powertrain #2 (which relates to the red tractive force curves you will see shortly)
Gray cells represent just helpful calculated reference values. DO NOT CHANGE THEM
Anything in yellow is a user input for you to define how you please
Tire size, rear gear, and final drive ratios are pretty straight forward inputs
You can plot out your power curve however works best for your application, just ensure that you plot all 7 points and that the rpm inputs are in ascending order from top to bottom. The gray colored top speed by gear in your transmission table is driven off highest RPM plotted in your power curve table. In the below example, the highest RPM in the power curve was 8500rpm, so all of the top MPH per gear are referencing that RPM value.
Transmission ratios are also pretty straight forward to understand. The spreadsheet is capable of managing all the way up to 8 speed transmissions. Simply fill in a "0" to the cell if that particular gear is not used on the transmission you choose.
Immediately under the transmission ratios you have a MPH input that you can use to understand your cruising RPM at a given speed. Again, this is more for helpful reference than anything if you are curious how your gearset selection will work on the street
Some common miata reference gearsets are saved under the transmission input table to make it easy to copy and paste various ratios around.
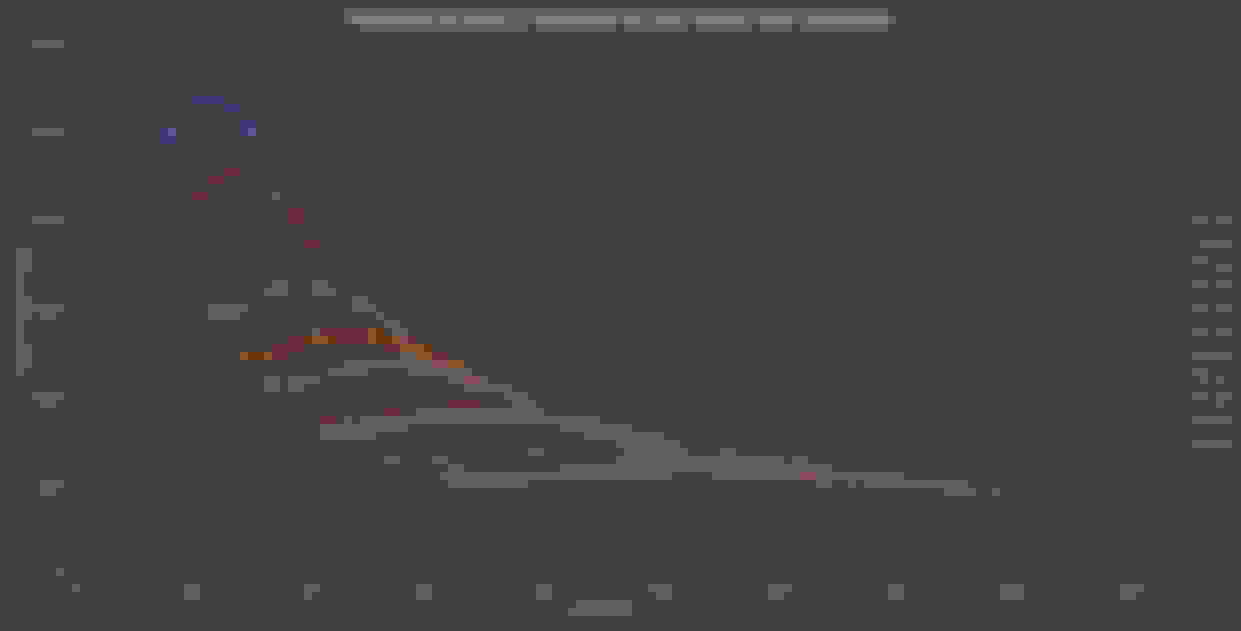
And then you finally get to the fancy graph outputs. Based on all the above information, you can see I kept everything the same on my inputs for this comparison except for the final drive ratio, so the comparison chart and the helpful gray reference cells noted above are showing what only a final drive difference will do. Below you can now correlate the blue inputs to the blue lines and the red inputs to red lines. The legend stands for Powertrain (PT) and Gear (G). Each of the 7 points on each curve correlates to your power curve RPM at that powertrain ratio per the legend, so in this case it is easy to quickly know that the leftmost point on each line is 2500rpm and the rightmost point on each line is 8500rpm.
Below the comparison chart, you can view powertrain #1 (blue) and powertrain #2 (red) each on their own graph, which can be helpful as the chart isn't so busy and cluttered with lines.
As a more advanced user, you can also right click the comparison chart, go to "select data", and uncheck each gear that you really don't care about for the sake of your analysis. By default, all gears in both powertrains are shown, but we all know that gears 3-5(or 6) are most frequently used in road course work, so hiding all 1-2 gears may be helpful to clean things up and allow the y-axis scale to adjust more clearly.
Anyways, if you have any questions let me know. Excel file is attached. Happy calculating you fellow nerds!
This is a very, very interesting spreadsheet. I've been wondering for years how the "speed in gear" calculators could be used to help me understand "acceleration in gear" - I intuitively knew there was a connection there through a dyno chart, but it's nice that someone else has done that work. Cats awarded, obviously.
I don't have a dyno for my yet-to-be-completed K24Z3 swap, so I just threw in some numbers from reading the original KPower story about the Z3 kit. I'm keeping the 4.1 rear from my 94, but swapped in a 6 speed because... that seemed to be the right choice at the time. This info makes the reason more clear, I think. Too bad the dyno of that engine is a bit funky, that's a pretty nasty cliff right in the middle there.
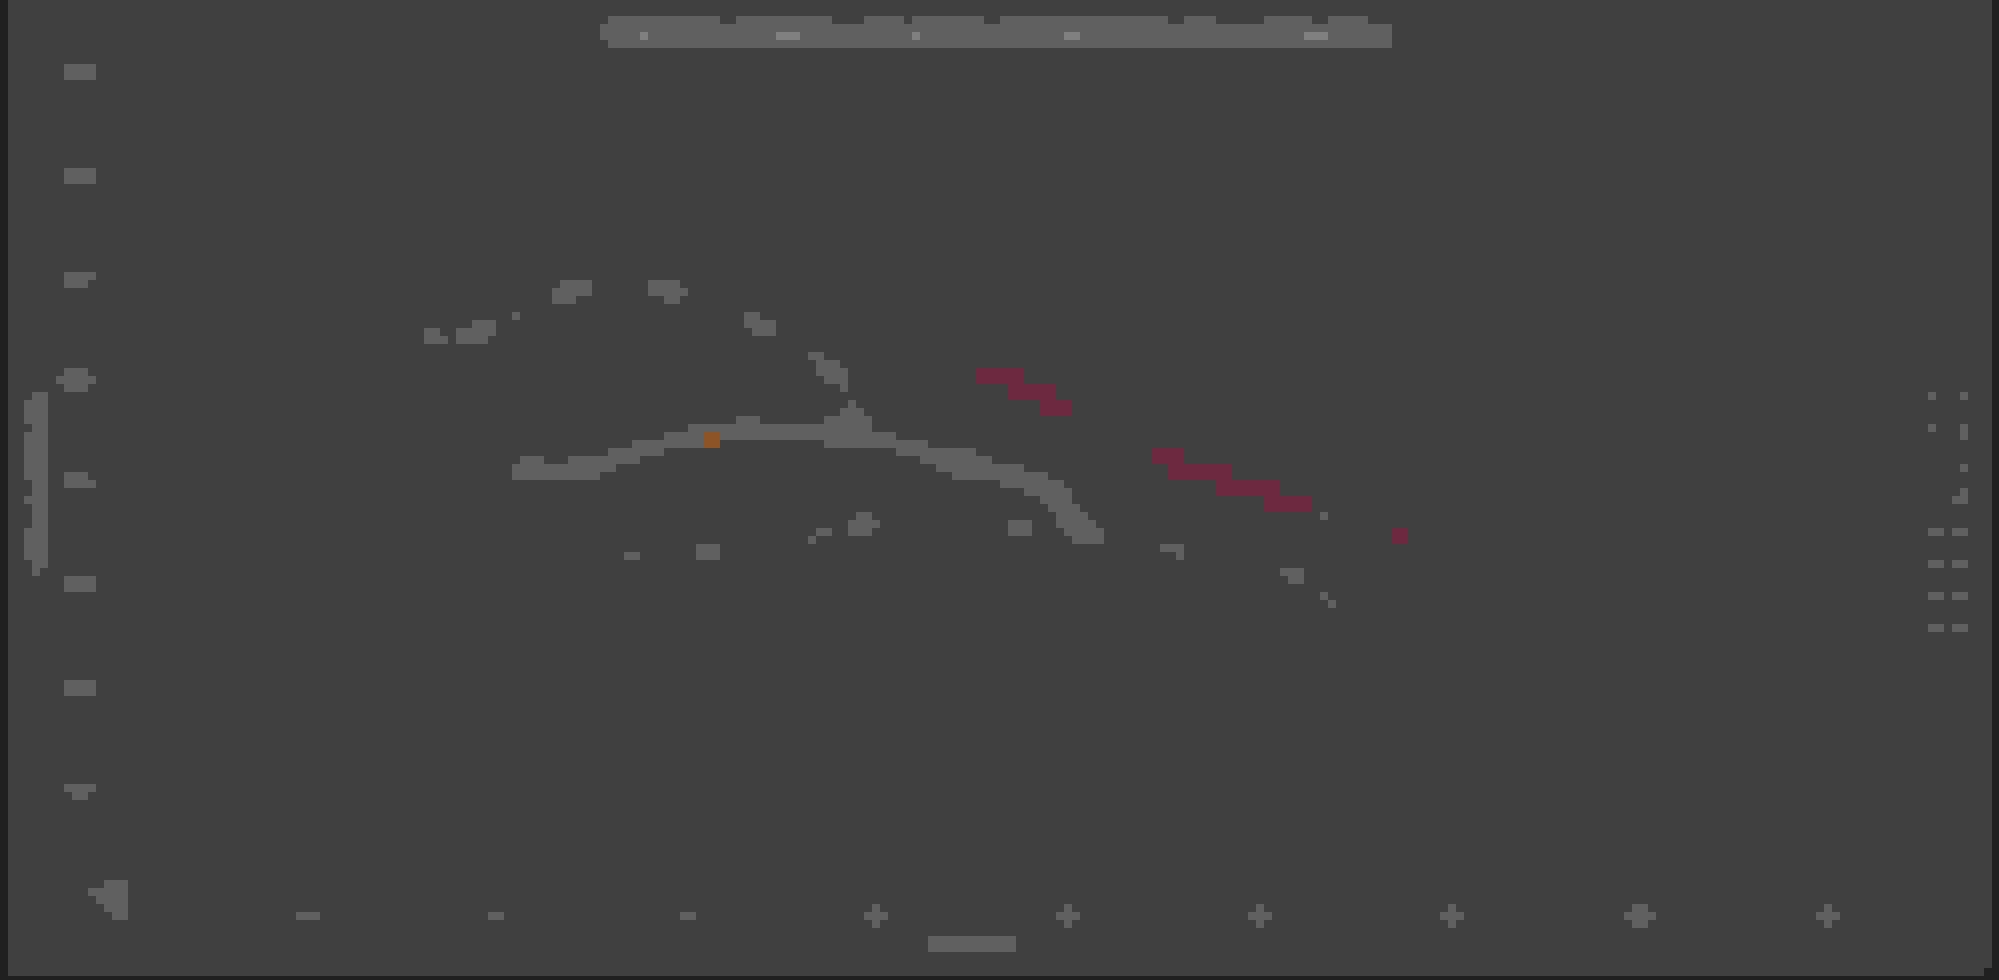
For a "theoretical" K24Z3, here is the comparison between the 5 speed and 6 speed, with the 4.1 rear. Note that the 4th/5th gear lines are overlaid since they're 1:1 in both transmissions (I had a duh moment trying to find the missing blue line).
And for my own amusement, here's my old BP (as best I recall, it was basically a flat 118lb/ft for the usable power band) with 5 speed vs the K24 with 6 speed. I think it'll be a meaningful improvement
Be careful how you input your power curve or else it can look like that stepped curve you see.. Your output will only look as good as your inputs are
Referencing KPI's blog post and dyno sheet, I got this smooth plot when plotted 7 points on the curve of their K24Z3 dyno
Using that power curve for both powertrains and comparing the 5spd and 6spd with a 4.1 diff gets you the following, which are much smoother outputs than you have.
For this setup, the top of 2nd in the 5spd has an advantage over its MPH range in 3rd in a 6spd, but then once you need to shift @ ~67mph, the 3rd in a 6spd has an advantage to ~75mph. Once above 75mph, the two gearsets are close enough that I wouldn't be to worried about one vs another. If you only need to get up to 67mph, then 5spd is a no brainer.. If you spend a lot of time on a given course in the 55-75mph range, the 6spd could be advantageous. This pretty much explains why nobody in the AutoX community really loves using the 6spd, because the gearing in 2nd gear is too short and you gear out quickly, but 3rd is too long for almost all courses. The 5spd is that happy medium with the gearing advantage.
For ***** and giggles I punched in the numbers for my M3 with the ST4 tune on it. (Note that the quoted tire is a Hoosier vanity size, in reality it just barely fits the 266mm template)
Yeah. That's why DBW throttle has a 0.2 power/weight modifier vs a cable throttle.
Yeah. That's why DBW throttle has a 0.2 power/weight modifier vs a cable throttle.
--Ian
Yeah, that is about as smooth as it gets for a tractive force plot. Cool seeing how it lays out that way after the numbers do their thing...
This is the setup that I'm moving back to on my K24A2. 5spd/4.3. I could short shift 4th by 500rpm or so if I wanted given the overlap, but otherwise letting that VTEC sing the song of its people with the good ole cable throttle body makes the most economical sense.
Just brainstorming if there is a way to take this spreadsheet to the next level and wanting to ramble a bit when sipping an evening beer.
A key thing I've been thinking about. Force = mass x acceleration
I've already gotten a pretty robust way of defining tractive force and mass is a pretty well known thing for all of us who track our cars, so in theory I could begin work plotting acceleration by gear plots. The idea being, if you know how fast you can accelerate at any given moment in whatever gear you are at, and you understand approximately how long a shift takes you, and you know approximately what your min corner speeds are, then one could back calculate what gear you want to be at for any given corner. It could give you more ability to understand if that extra shift is worth your time. You could also use this to better calibrate a shift light by gear if you have such capability on your tach display.
The challenge with all this is: aero drag. Forward force the tire is making is counteracted exponentially as you go faster by air drag, which can be defined as
F_drag = 1/2 * rho * V^2 * A * C_d
where, rho = air density, V = velocity, A = cross sectional area of car, and C_d = coefficient of drag
One could make some assumptions on the F_drag over the speeds we are referring to and I could subtract F_drag from F_Tractive from the powertrain to get an adjusted acceleration by gear curve. I believe what it would tell you is that gearing is more important as you get up to higher speeds, so your acceleration by gear curves will start to deviate more the faster you go. Given the pretty hefty number of assumptions required, I'm not sure its worth looking into for some continuous improvement or if I am too far into the "just buy an AIM already and review your data logs if you want to know this" territory?
One could make some assumptions on the F_drag over the speeds we are referring to and I could subtract F_drag from F_Tractive from the powertrain to get an adjusted acceleration by gear curve. I believe what it would tell you is that gearing is more important as you get up to higher speeds, so your acceleration by gear curves will start to deviate more the faster you go. Given the pretty hefty number of assumptions required, I'm not sure its worth looking into for some continuous improvement or if I am too far into the "just buy an AIM already and review your data logs if you want to know this" territory?
The goal of these graphs is to learn about the effect that different sets of transmission ratios have on acceleration, right? Aero drag doesn't care what gear you're in, just the speed.
The goal of these graphs is to learn about the effect that different sets of transmission ratios have on acceleration, right? Aero drag doesn't care what gear you're in, just the speed.
--Ian
As currently created, yes, these graphs provide a visual way to understand what gearsets are best for your specific application...
You are right that aero drag doesn't care about gearing. Thinking about that further (even if I did sort out a way to add aero into the equation), you'd simply expect aero drag to increase as tractive force decreases (with ever higher gearing) which would draw the net tractive force down (regardless of gear) to zero as you find your aero limited top speed. Regardless of what that aero drag curve looks like, you'd still want to find the gear with most tractive force as possible for that given speed, so the value in having aero added is relatively pointless for the sake of the goal.
Being the nerd that I am ... I decided to do a direct comparison between the KPI power curve + 6-speed and Ian's ST4 M3, since my hope has been to slot this car into ST4 and Ian is coincidentally in my NASA region.
My thought is that for Sonoma + Thunderhill, NorCal's two home tracks, the most interesting range is from 40 to 100, maybe 110? I've dropped out gears 1, 2, and 6 in order to maximize the relevant data.
And thank you Padlock for cleaning up the KPI inputs, "garbage in, garbage out" and all that.
The M3 clearly trounces the K24 in terms of tractive force.
I'm not a physicist, but if I recall, F = MA. We now have F, and M is pretty easy to figure out.
Keeping this all a theoretical exercise (assume a spherical cow), if we were to ignore aero drag and all the other caveats, how easy would it be to come up with an "acceleration in gear" comparison that shows that the lighter Miata is going to run circles around the porcine M3?
I fiddled a bit with numbers and learned a physics or two.
1) Screw US units. Always.
2) I wasn't able to devote the time to make the graph work, but from some manual work (starting with converting to meters and newtons), it looks like Ian is still ahead by around 0.1g where it matters...
To me, that calculation is pretty easy to understand from a power to weight ratio perspective by just glancing at the chart.
If you look at Ian's curve vs yours, I think its reasonable to say that he is making around 20% more force to the tire than you would at any given speed. Given F=ma, that means for acceleration to be equal, his car must be ~20% heavier than yours to accelerate at the same rate. If he's over 20% heavier, you'll be faster and vice versa.
I fiddled a bit with numbers and learned a physics or two.
1) Screw US units. Always.
2) I wasn't able to devote the time to make the graph work, but from some manual work (starting with converting to meters and newtons), it looks like Ian is still ahead by around 0.1g where it matters...
Heh. The smooth tractive force curve comes from having a very flat power curve over the range that the transmission covers, so that when you hit redline in one gear and upshift, the engine is still making the same amount of power. It's ideal for a power/weight class like ST, especially at our local tracks where speeds range between about 45 and 115. You can cover that range in an M3 with just 2 gears (3rd and 4th) and even then I only use 3rd in a few places (turns 2, 7, and 11 at Sonoma, 3 and 11 at Thunderhill).
The S54 does this because it's got excellent head flow and enough displacement to make torque at low RPMs. The K motor has the head flow, but it's down a lot on displacement so the flat power region is narrower and upshifts will take you to an RPM with less power.
This is really a bit artificial though, because of the way the NASA rules work. With the full tune on the car it makes 330 at the wheels and the graph looks a bit different:
The red curve isn't nearly as smooth, but the car is much faster with it. To take full advantage of it, though, you'd need a much closer-ratio transmission with many more shifts, say 4 gears to cover the same speed range as the 2 I'm using now. Maybe that's doable with a dual clutch flappy paddle transmission? Dunno.
I decided to do a direct comparison between the KPI power curve + 6-speed and Ian's ST4 M3
BTW, there's an error in your data -- my car has a 4.10, not a 3.62. It doesn't really make a lot of difference (power is power and as long as you're using all of multiple gears the final drive just changes where and potentially how many times you shift), but just FYI.
BTW, there's an error in your data -- my car has a 4.10, not a 3.62. It doesn't really make a lot of difference (power is power and as long as you're using all of multiple gears the final drive just changes where and potentially how many times you shift), but just FYI.
--Ian
Ha! See, I saw that and thought, "heh, Ian forgot to change out the Miata ratio"... That's what I get for assuming. I'm a
For ***** and giggles I punched in the numbers for my M3 with the ST4 tune on it. (Note that the quoted tire is a Hoosier vanity size, in reality it just barely fits the 266mm template)
Yeah. That's why DBW throttle has a 0.2 power/weight modifier vs a cable throttle.
--Ian
Thats a beautiful curve, but does DBW have anything to do with that, or is it just a function of an OEM-matched powerband and gearset, versus engine swap bastard drivetrains?
Super cool calculator!! Thanks for all the work you did on this, its really interesting. An interesting tweak could be to make tire diameter and section width user-definable for race tires that are really different sizes than their nominal equivalents, like Codrus' hoosiers for example, that are a full 20mm wider than a quoted 245 at the same overall diameter.


 14
14