How to find your injector dead time
 06-09-2011, 09:50 AM
#41
Elite Member
iTrader: (1)

Join Date: Jun 2006
Location: Warrington/Birmingham
Posts: 2,642
Total Cats: 42
here's the thing, all the deadtime code does is add that value to the end of your calculated pulsewitdh. if the code calculated 1.7ms and you have a deadtime of .8ms, it will fuel 2.5ms total.
Just pick a number and go with it. Tune the voltage correction curve to mirror that of the published rates and be done with it.
Just pick a number and go with it. Tune the voltage correction curve to mirror that of the published rates and be done with it.
See Jasons 1st post in this thread for why they're important.
I disagree totally with guessing the deadtime. getting it correct is key in achieving a consistent setup specifically at idle.

Reply
 0
0

0


 06-09-2011, 01:20 PM
#45
2 Props,3 Dildos,& 1 Cat


iTrader: (8)
Join Date: Jun 2005
Location: Fake Virginia
Posts: 19,338
Total Cats: 573
if the ECU calculates you need 1.7ms, it will inject .9ms and let the dead time take care of itself. the injector will then be open for a total of 1.7ms.
Reply
0
0
06-09-2011, 05:12 PM
#46
Junior Member

Join Date: Jun 2007
Posts: 411
Total Cats: 0
Well in fairness, he was referring to the previous post where there was a choice between 2 dead times for the RX-8 injectors 
Back to the RX-8 injector- how do we get the battery correction curve right if there are no published rates?
Back to the RX-8 injector- how do we get the battery correction curve right if there are no published rates?
Last edited by Greg G; 06-09-2011 at 06:07 PM.
Reply
0
0
06-10-2011, 03:56 PM
#47

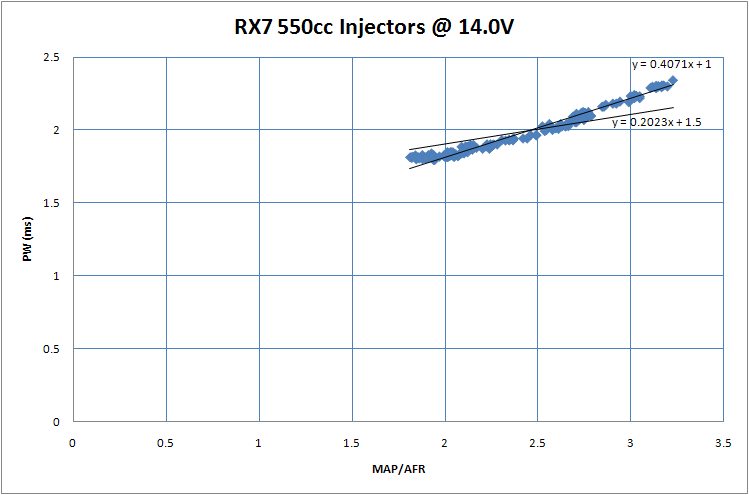
I'm running 550cc RX7s, but didn't see any specific info on them, so I tested my own. Looks pretty close to Brain's (RX7 460s), but again, there's 2 different slopes so I'm not sure what to set. Depending on values I'm looking at, I can see anywhere between 1.0ms to 1.6ms.
To relate this to real world tests on my car...until today I have ran a dead time of 1.0. I needed values in the 60s in my VE table to get a 14.7 idle...always seemed high to me. Today, when changing dead time to 1.5ms, VE values in the 30s gives me the same idle. I'm thinking I ought to just keep my 1.5ms setting, but not sure...what do you all think?
Another question I have is.... the "open time" setting under "injector characteristics" in MS2- is that asking for the dead time at a certain voltage? Because the parameter after "open time" is the battery correction in ms/v. I understand that the dead time will change with voltage and that's the value we use to define the 'slope'...but what voltage is going to be referencing that from? 13.2V seems to be some sort of common value?
Last edited by aaronc7; 06-10-2011 at 06:26 PM.
Reply
0
0
06-10-2011, 06:31 PM
#48
just 'figured out ' that it does indeed reference that value @ 13.2V... (MS2)
http://msextra.com/forums/viewtopic....oltage#p285337
so, assuming I'm going to with 1.5ms dead time at idle @ 14 volts batt voltage, and .2ms/V slope in MS.... I should set about 1.3 in the "open time" field, correct?
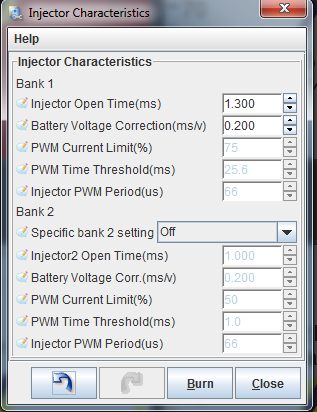
edit: i got it backwards....probably a setting of 1.6ms and .1ms/v would get me 1.5ms dead time at 14V. is this the idea?
http://msextra.com/forums/viewtopic....oltage#p285337
so, assuming I'm going to with 1.5ms dead time at idle @ 14 volts batt voltage, and .2ms/V slope in MS.... I should set about 1.3 in the "open time" field, correct?
edit: i got it backwards....probably a setting of 1.6ms and .1ms/v would get me 1.5ms dead time at 14V. is this the idea?
Last edited by aaronc7; 06-10-2011 at 08:39 PM.
Reply
0
0

 09-24-2011, 11:01 PM
#55
I thought I would share some more of my data. I am using the published injector data, but never went back and collected any experimental data to compare. Here it is. The first graph is a large dataset. The calculated deadtime is very close to the theoretical for the battery voltage in which the data was collected. However ther is a very tight group of points that a y intercept of 1.1 fits rather nicely.
The lower graph has the excel calculated y intercept,a nd then a couple that I selected just to see how they fit. During the data collection the battery voltage held steady at 14.2V with the injector deadtime set to .734ms at 13.2v. Publish data would suggest a deadtime of .604 at 14.2V
Please post your opinions about what you see.
Should be using published data or experimental data?
Reply
0
0
09-26-2011, 02:48 PM
#56
Elite Member
Thread Starter

Join Date: Jul 2005
Posts: 6,420
Total Cats: 84
Eyeballing the *upper* graph above shows 3 major trendlines. You can't just take a single trendline from the above. You have to find out what is making the trendline change - e.g. did battery voltage change due to fans turning on, or was part of it after a hot restart, etc.
Having 3 different distinct trendlines is different than getting a single trace with a curve in it. In the latter case, you look at the trendline where accurate afr control is most critical - idle at min RPM with min loading (no fans, no ac, charged battery), in the region of about 15:1 afr.
How did you vary the AFR to generate the dataset in the upper plot?
Reply
0
0
09-26-2011, 06:17 PM
#57
Eyeballing the *upper* graph above shows 3 major trendlines. You can't just take a single trendline from the above. You have to find out what is making the trendline change - e.g. did battery voltage change due to fans turning on, or was part of it after a hot restart, etc.
Having 3 different distinct trendlines is different than getting a single trace with a curve in it. In the latter case, you look at the trendline where accurate afr control is most critical - idle at min RPM with min loading (no fans, no ac, charged battery), in the region of about 15:1 afr.
How did you vary the AFR to generate the dataset in the upper plot?
Having 3 different distinct trendlines is different than getting a single trace with a curve in it. In the latter case, you look at the trendline where accurate afr control is most critical - idle at min RPM with min loading (no fans, no ac, charged battery), in the region of about 15:1 afr.
How did you vary the AFR to generate the dataset in the upper plot?
Reply
0
0
09-26-2011, 11:06 PM
#59
I did take a log where I adjusted the pulsewidths, but I don't believe this this data was taken from that log. Adjusting the pulsewidth resulted in an idle of 17:1. I didn't think this was possible.
It's a graph of pw vs map/afr
I wonder if I used a log where I was adjusting the injection timing table. I'll take another one when I get my computer sorted.
It's a graph of pw vs map/afr
I wonder if I used a log where I was adjusting the injection timing table. I'll take another one when I get my computer sorted.
Reply
0
0


