When you click on links to various merchants on this site and make a purchase, this can result in this site earning a commission. Affiliate programs and affiliations include, but are not limited to, the eBay Partner Network.
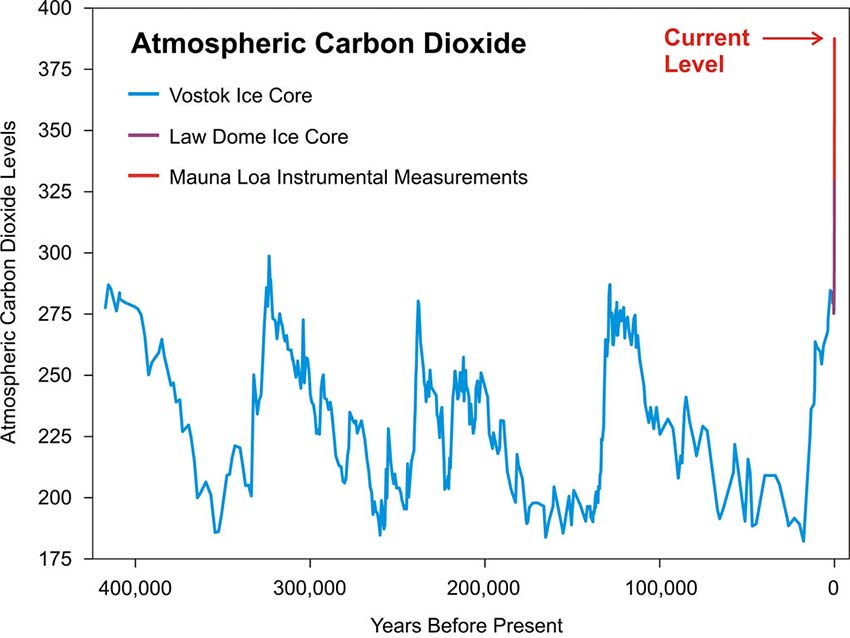
If we take a look at this historical graph, we can see that for the last 400,000 years co2 varied between 175 and 300 ppm - or doubling and then halving about every 100,000 years. To put that into scale, during the last 150 years, we've gone from 285 to 410, which is an increase of about 50%. We've broken any historical trend by a huge margin.
Looks like they are combining three different measurement methods. That's like comparing a Mustang dyno to a Dynojet. Not very scientific. Especially since they are being paid to find certain things and ignore data that doesn't fit or they lose their jobs.
If it was true, plants would be much healthier and grow faster than ever before. Which would mean lower CO2. Wait, how does that work?
Because 13 times as many people on the earth since 1700 is a lot of people breathing and farting out CO2, and a lot more extra tasty animals (which breathe and fart CO2) being raised for consumption.
How many people would you suggest we kill, based on your theory of human destruction of the planet? Who decides, based on your totally unbiased "settled science", who lives and dies? Certainly I would be among the first since I am a heretic.
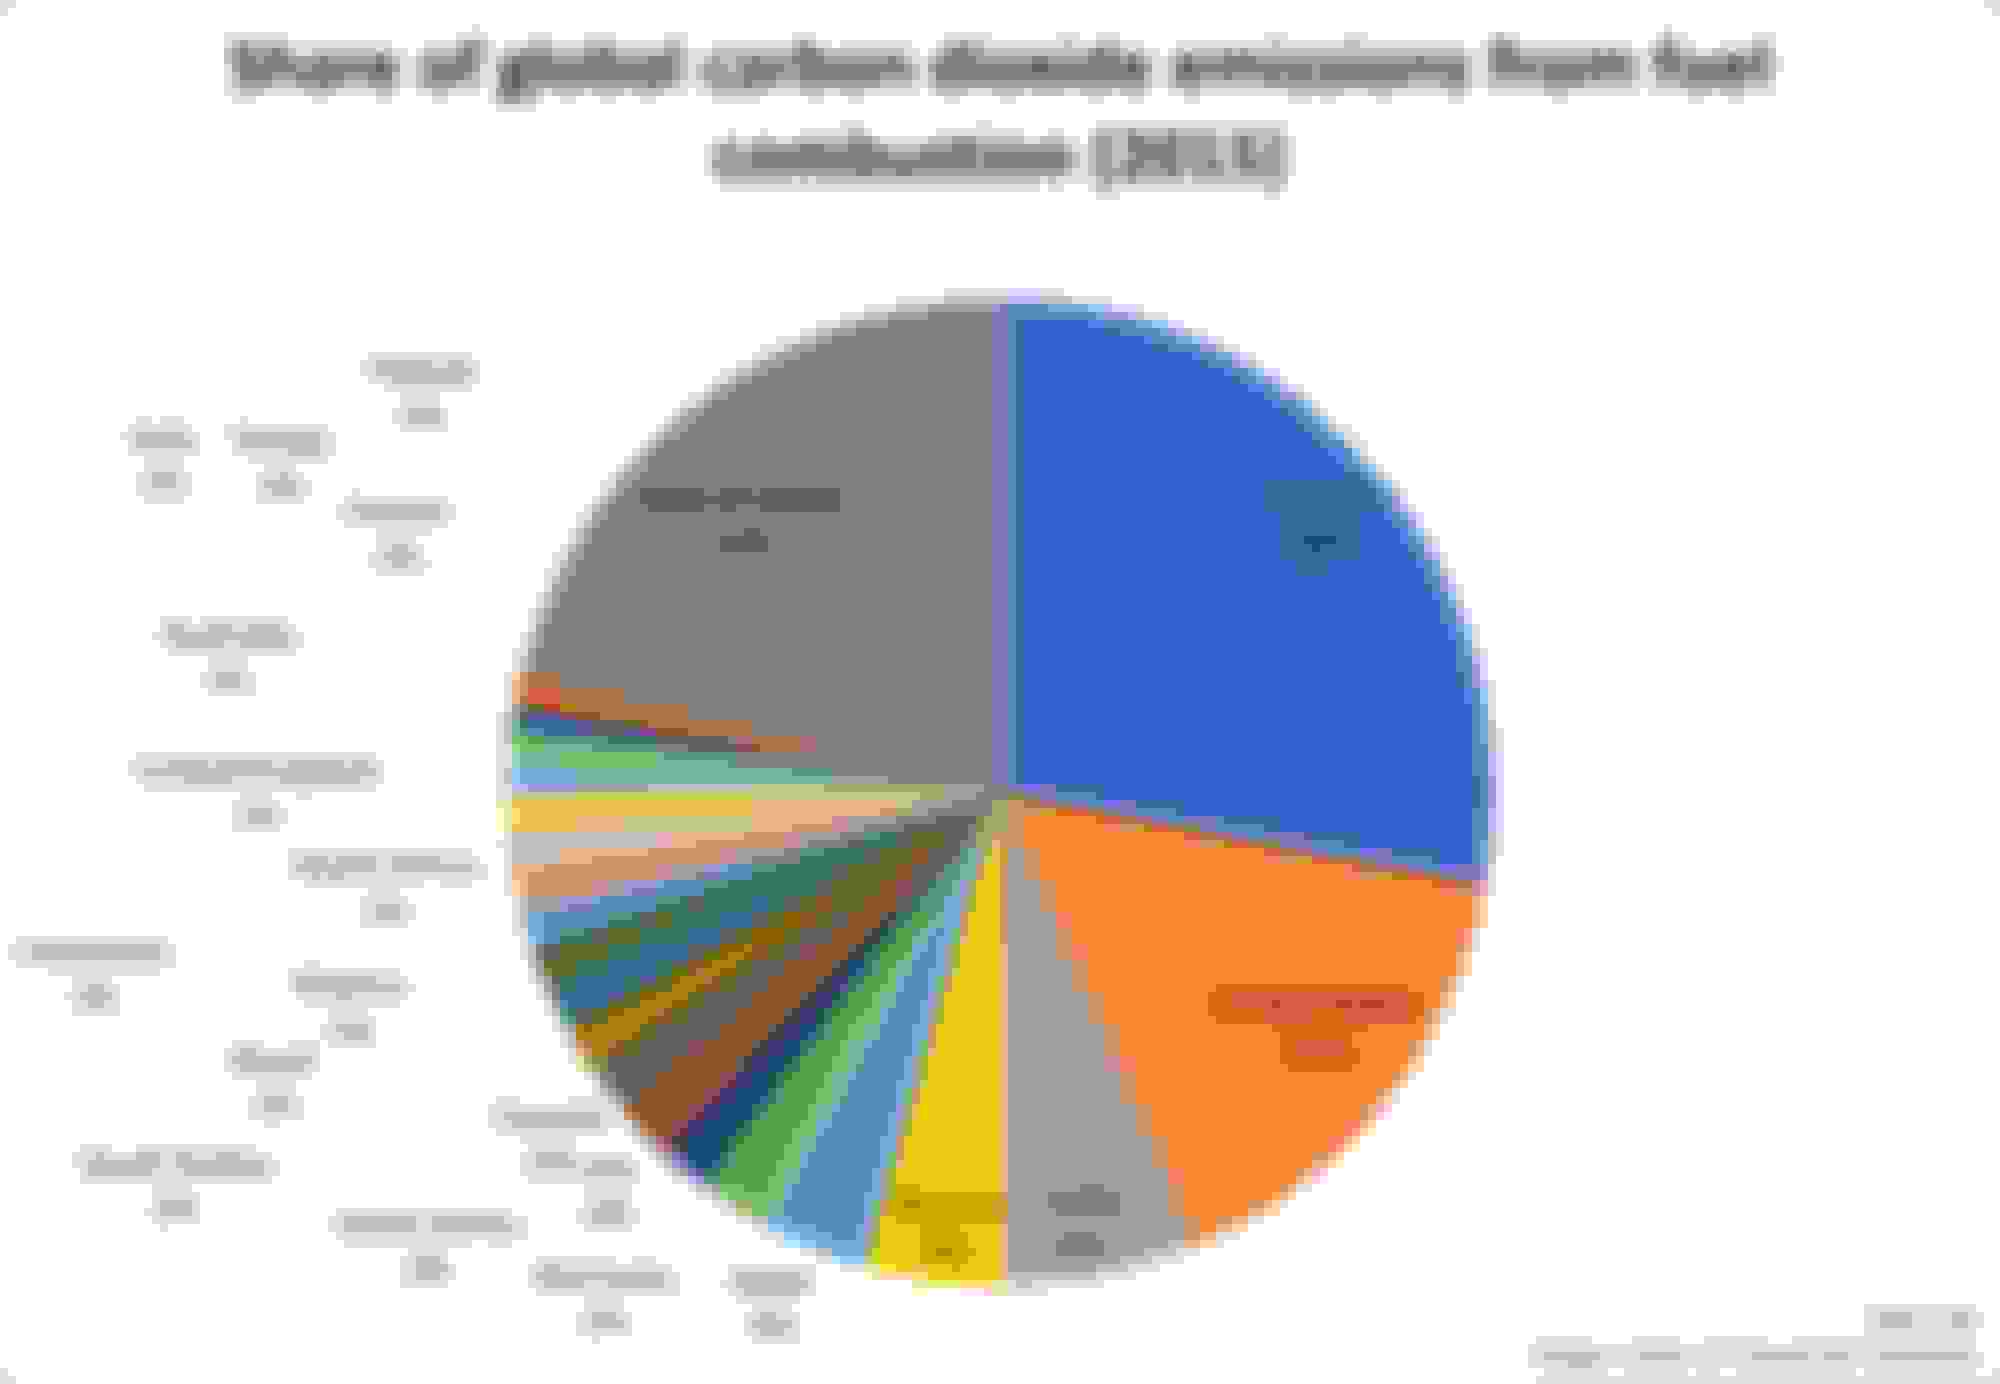
But wait. Who is the actual problem? Only 325 million people in the U.S. while India has 1,350,000,000 and China has 1,419,000,000. All of the South American continent only has 432 million. Indonesia has almost as many people as the whole USA at 270 million.
US is #2 in total emissions, behind China, ahead of India. We, along with the other industrialized nations of the world, consume / emit far more per capita than emerging nations.
(I write this while fuelling up a 31' RV.)
While something the size of the earth's atmosphere is complex, multivariable, and difficult to model, it's hard tp argue against the following:
1: The rate of increase, and absolute level, of CO2 in the atmosphere rose higher following the industrial revolution than at any other time in earth's history short of events such as extinction-level meteor impacts.
If you think CO2 emissions are a problem, and I don't, nuclear is obviously the answer to our energy needs except for the fact that electric cars produce more CO2 in their combined construction and operation than gasoline-powered vehicles. I'm also a big fan of hydroelectric power, which I think is an underutilised prospect complicated by the expense of purchasing land to flood. Solar technology is improving but still costs much more to construct than it is worth in my opinion. The ROI has really improved in the last 5 years. Maybe in 10 more years it will be really good.
Looks like they are combining three different measurement methods. That's like comparing a Mustang dyno to a Dynojet. Not very scientific. Especially since they are being paid to find certain things and ignore data that doesn't fit or they lose their jobs.
Do you work in academia? Even though there is pressure on researchers to publish, you are implying that 95%+ (see link above) of them are conspiring to lie to the public. To me, that seems like "9/11 was an inside job" levels of conspiracy theory.
Also, your analogy isn't entirely accurate. A better analogy would be to put an na, nb and nc on the same dyno and then compare the results - which does work. If you want to read more, this might be a good source https://skepticalscience.com/argumen...p=2&t=92&&a=55.
If it was true, plants would be much healthier and grow faster than ever before. Which would mean lower CO2. Wait, how does that work?
A tree is carbon neutral (aka carbon sink) at best, as it releases its co2 again when it dies. The problem is: even with the slightly faster tree growth (it's not only dependant on co2), we are still polluting much more than the plants can absorb. Deforestation also doesn't help here.
Because 13 times as many people on the earth since 1700 is a lot of people breathing and farting out CO2, and a lot more extra tasty animals (which breathe and fart CO2) being raised for consumption.
How many people would you suggest we kill, based on your theory of human destruction of the planet? Who decides, based on your totally unbiased "settled science", who lives and dies? Certainly I would be among the first since I am a heretic.
What you're saying here is that co2 is mostly manmade. I guess we finally agree. However, killing people is not a solution for various obvious reasons, but having less children definitely is one of the things society should consider - take a look at https://www.theguardian.com/environm...fewer-children.
But wait. Who is the actual problem? Only 325 million people in the U.S. while India has 1,350,000,000 and China has 1,419,000,000. All of the South American continent only has 432 million. Indonesia has almost as many people as the whole USA at 270 million.
As Joe also said, the US has about the highest co2/capita, and therefore can play a significant role. E.g., despite the US having 1/4th of the people of India, it sends about 2.5 times as much co2 into the air. And Joe's China statistic is even misleading, as China emits a lot of co2 to produce products that then get used in the Western world. But obviously, other countries will also have to play their part.
If you think CO2 emissions are a problem, and I don't, nuclear is obviously the answer to our energy needs except for the fact that electric cars produce more CO2 in their combined construction and operation than gasoline-powered vehicles
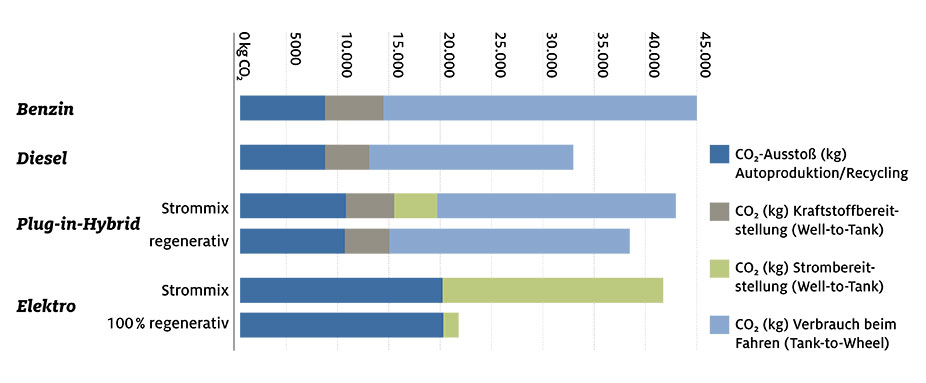
Also this recent ADAC report (i.e. not the government..) shows:
With the current electricity generation in Germany, electric cars are slightly better from an LCA perspective than a gas powered car. They truly get interesting when renewable sources are used.
The exact results depend a bit on the parameters used - especially how long a battery lasts. But so far, it seems most Teslas by far exceed expectations when it comes to battery life - thereby making the cradle to grave assessments much more in favor of electric cars.
Also, I'm greatly in favor of nuclear, wind and photovoltaic energy sources. Biggest downside to nuclear currently is cost/kWh, as the safety requirements make a nuclear plant pretty expensive. But for me personally, it's a premium I'd be willing to pay over coal.
Still, you're showing a graph that shows three different ways of measuring CO2 levels and trying to tell me it's the same measurement. And you are telling me I am supposed to be alarmed that it is shooting up like a rocket on your graph and yet I see no demonstration of a diminished quality of life on Earth commensurate with such a supposed drastic change. You say it doubled or more in the last hundred something years and yet I don't see any giant Al Gore tidal waves 40 stories high in New York City as the morons who made the movie portrayed. In fact I don't see anything other than the tiniest of cyclical changes just as we've seen for a thousand years, except for the "Little Ice Age" and "The Year Without a Summer."
Little Ice Age:(Wikipedia)
The NASA Earth Observatory notes three particularly cold intervals: one beginning about 1650, another about 1770, and the last in 1850, all separated by intervals of slight warming.
Several causes have been proposed: cyclical lows in solar radiation, heightened volcanic activity, changes in the ocean circulation, variations in Earth's orbit and axial tilt (orbital forcing), inherent variability in global climate, and decreases in the human population (for example from the Black Death and the colonization of the Americas).
The second paragraph can be summed up as saying they have no clue what caused it and we can only assume if it happened today that people would be behaving just as foolishly as ancient Aztecs would in the presence of a solar eclipse. It would be unfortunate and dangerous. People who claim that there is climate change would most certainly be right and still have no greater idea than the day they were born what was causing any of it. Of course there is climate change. There has always been climate change. It predates us.
Help, I'm dying of carbon dioxide being increased slightly in the atmosphere.
Scientists claim that sea ice(and therefore ice) absorbs major amounts of CO2 from the atmosphere. They also claim that they can measure the amount of CO2 in ancient air bubbles trapped in ice, thus telling us that CO2 was much lower in the past 800,000 years.
If ice absorbs CO2, how do we know that the air in those ancient bubbles did not loose it's CO2 to the ice surrounding it?
This paper provides some insight. You might have to dive into some of the citations.
Still, you're showing a graph that shows three different ways of measuring CO2 levels and trying to tell me it's the same measurement. And you are telling me I am supposed to be alarmed that it is shooting up like a rocket on your graph and yet I see no demonstration of a diminished quality of life on Earth commensurate with such a supposed drastic change. You say it doubled or more in the last hundred something years and yet I don't see any giant Al Gore tidal waves 40 stories high in New York City as the morons who made the movie portrayed.
The thing is, significant climate change has not yet occurred. It's quite unlikely that during our lives significant climate change will occur. However, we are getting to the point of no return. At the current rate, it's expected to have +2 degrees on average by 2050 and about +4 degrees by 2100. The consequences are neatly summed up in this infographic. If you want to read more, there's a good wiki page on it.
In fact I don't see anything other than the tiniest of cyclical changes just as we've seen for a thousand years, except for the "Little Ice Age" and "The Year Without a Summer."
The second paragraph can be summed up as saying they have no clue what caused it and we can only assume if it happened today that people would be behaving just as foolishly as ancient Aztecs would in the presence of a solar eclipse. It would be unfortunate and dangerous. People who claim that there is climate change would most certainly be right and still have no greater idea than the day they were born what was causing any of it. Of course there is climate change. There has always been climate change. It predates us.
Climate change is not new. The climate change that is currently going on, is by all accounts man-made and expected to have significant societal impact in the next 100 years.
Help, I'm dying of carbon dioxide being increased slightly in the atmosphere.
You are not. In the generations to come there will most likely be a significant amount of deaths due to man-made climate change. Significant parts of the world will become uninhabitable. The world will not be able to provide enough food for the amount of people alive then. Mass emigration will put a heavy strain on nations that are not as affected.
Anyway, this'll be my last post on this topic before I turn into this guy. I just want to end with saying that I'm concerned that people are flat-out denying scientific consensus. There are few topics where scientists are in agreement as much as they are on man-made climate change. Saying they are wrong, implies that you know more than the brightest minds of this world working together. Saying they are wrong, implies that the scientific method doesn't work. The scientific method has given us electricity, doubled our life expectancy from 40 to 80 in the last 200 years and put men on the moon. Literally almost everything you have in your life, you have due to science.
The thing is, significant climate change has not yet occurred. It's quite unlikely that during our lives significant climate change will occur. However, we are getting to the point of no return. At the current rate, it's expected to have +2 degrees on average by 2050 and about +4 degrees by 2100. The consequences are neatly summed up in this infographic. If you want to read more, there's a good wiki page on it.
I think this graph speaks for itself. The sharp rise we've seen in the last 100 years is unlike any change ever before.
Let's take a closer look at that graph and see what it tells us.
Climate change is not new. The climate change that is currently going on, is by all accounts man-made and expected to have significant societal impact in the next 100 years.
Oh really?
The last five million years of climate change is shown in the graph based on work by Lisiecki and Raymo in 2005 [2] . It shows our planet has a dynamic temperature history, and over the last three million years, we have had a continuous series of ice ages (now about 90,000 years each) and interglacial warm periods (about 10,000 years each). There are 13 (count ‘em) ice ages on a 100,000 year cycle (from 1.25 million years ago to the present, and 33 ice ages on a 41,000 year cycle (between 2.6 million and 1.25 million years ago). Since Earth is on a multi-million-year cooling trend, we are currently lucky to be living during an interglacial warm period, but we are at the end of our normal 10,000 year warm interglacial period.
The next graph of temperature from the ice core for the last 10,000 years (the current interglacial period) shows that Greenland is now colder than for most of that period (vertical scale in degrees C below zero). We can see the Medieval Warm Period 800 to 1,000 years ago was not particularly warm, and the Little Ice Age 150 to 650 years ago was one of the longest sustained cold periods during this interglacial. We are now recovering from this abnormal cold period, and the recovery started long before anthropogenic greenhouse gases were produced in any quantity. The curved trend line in green shows that we have been experiencing declining temperatures for the past 3,000 years, and are likely to be heading down toward the next ice age. Temperatures are only considered to be increasing if viewed for the last 150 years, from 1850 onward, which is roughly when thermometers began collecting global data, and is also the period of time the UN’s Intergovernmental Panel on Climate Change (IPCC) has chosen for its review. The red portion of the curve is the recovery from the Little Ice Age. The amount of 20th century warming is unknown, since it was recently revealed that unknown portions of the international temperature databases have been tampered with, and the amount and extent of the tampering has not been publicly documented. It is likely that some warming has continued into the 20th century, but it is also likely that the amount of warming is not as great as the 0.6 degrees C that the global warming advocates would lead us to believe.
Our current warming is well within natural variation, and in view of the general decline in temperatures during the last half of this interglacial, is probably beneficial for mankind and most plants and animals. The graph clearly shows the Minoan Warming (about 3200 years ago), the Roman Warming (about 2000 years ago), and the Medieval Warm Period (about 900 years ago). Great advances in government, art, architecture, and science were made during these warmer times.
Long-term, temperatures are now declining (for the last 3,000 years), and we appear to be headed for the next 90,000 year ice age, right on schedule at the end of our current 10,000 year warm period. We have repeated this cycle 46 times in succession over the last 2.6 million years. And in case you are wondering, the previous Antarctic ice cores tell a broadly similar story. The following graph of ice core data from Vostok (vertical scale in degrees C variation from present) shows that Antarctica is also experiencing a long-term (4,000 year) cooling trend mirroring the Greenland GISP2 cooling trend. Though the individual temperature spikes and dips are different than in Greenland, the long-term temperature trend on the planet appears to be down, not up. And since it is so late in our current interglacial period, we could be concerned about global cooling.
The US is currently drilling a new ice core (see here), already at 1,512 meters where it is 7,700 years old, that is dated absolutely by counting annual ice layers, and each layer will be analyzed for temperature, greenhouse gases, and other constituents. This will give us the best Antarctic record yet. I believe the results will confirm the above. We geologists owe it to policy-makers to give them the benefit of our longer-term perspective. I believe we will regret regulating CO2, since doing so will not produce any measurable climate control, and may actually cause great harm to world economies. If we want to promote renewable energy sources (and I do), let us not penalize fossil fuel production and use. We may soon need all the energy we can produce, if the long-term cooling continues.
Warming is not a killer, but global cooling is. It would only take a few years of global crop failures from cold weather to put populations at serious risk. Both the Antarctic and Greenland ice sheets are thickening: Leave anything on the ice, and it gets buried pretty fast (for example: the US South Pole Base was recently reconstructed because the old base was being crushed by snow and ice, and WWII planes lost on Greenland’s southeast coast, were covered by 264 feet of ice in 50 years: see the image below). This is not rocket science. Sure, the sea-level edges are retreating (that is why we call them the ablation zones of a glacier), but they represent a minute portion of the continent-scale ice mass.
Greenland and the GISP cores are just one point on the globe. It’s hard to know what temperatures in the tropics were by drilling in the Arctic Circle. However, we do have hundreds of studies regarding the Medieval Warm Period about 1,000 years ago, and, clearly, the higher temperatures affected most of the globe (as I discuss in my post on why the Hockey Stick is audaciously wrong).
But, the Vostok ice core graph is not mirroring the detail in GISP. Why should we rely on Greenland as a better climate guide for the planet? Svensmark suggests that Antarctica responds uniquely. Because it is covered in Earth’s most reflective ice and snow, it has a very high albedo, sending most of the incident sunlight right back to space. The Arctic is not as white, and neither is Greenland. Greenland is also tied to local water and wind patterns, whereas the Antarctic is more isolated, and completely surrounded by vast oceans. The result is that cloud cover changes have a different effect on Antarctica. The theory goes that if the world becomes cloudier, most places cool, but Antarctica warms. The cloud tops are actually less reflective than Antarctic snow, and they re-radiate the heat they absorb. They also trap heat from below, preventing it from escaping into space. An effect like this means that while Antarctica is a good indicator of big climate movements, it may not be so good for smaller changes on smaller time scales. Hence, Greenland may be a better indicator of planetary climatic trends over the past 10,000 years.
Fitting with this is the trend of the last few decades where most of the world warmed, but Antarctica cooled and its sea ice increased. And as it happens, just today comes word of another cringeworthy error in AR4: They managed to whitewash the steady growth in Antarctic sea ice, and underestimate it by 50%. (When the facts don’t fit your theory, change the facts…)
1 J. Zachos, et al (2001) – Trends, Rhythms, and Aberrations in Global Climate 65 Ma to Present, Science 292 (5517), 686–693
2 L. E. Lisiecki and M. E. Raymo (2005) – A Pliocene-Pleistocene stack of 57 globally distributed benthic δ18O records, Paleoceanography 20, 1003
Originally Posted by Skamba
I'm concerned that people are flat-out denying scientific consensus. There are few topics where scientists are in agreement as much as they are on man-made climate change. Saying they are wrong, implies that you know more than the brightest minds of this world working together. Saying they are wrong, implies that the scientific method doesn't work. The scientific method has given us electricity, doubled our life expectancy from 40 to 80 in the last 200 years and put men on the moon. Literally almost everything you have in your life, you have due to science.
I'm saying the science is polluted by politics and money. It's pretty simple.
Real science invites dissenting theories relative a hypothesis.
The episodic nature of the Earth's glacial and interglacial periods within the present Ice Age (the last couple of million years) have been caused primarily by cyclical changes in the Earth's circumnavigation of the Sun. Variations in the Earth's eccentricity, axial tilt, and precession comprise the three dominant cycles, collectively known as the Milankovitch Cycles for Milutin Milankovitch, the Serbian astronomer and mathematician who is generally credited with calculating their magnitude. Taken in unison, variations in these three cycles creates alterations in the seasonality of solar radiation reaching the Earth's surface. These times of increased or decreased solar radiation directly influence the Earth's climate system, thus impacting the advance and retreat of Earth's glaciers.
It is of primary importance to explain that climate change, and subsequent periods of glaciation, resulting from the following three variables is not due to the total amount of solar energy reaching Earth. The three Milankovitch Cycles impact the seasonality and location of solar energy around the Earth, thus impacting contrasts between the seasons.
Eccentricity
The first of the three Milankovitch Cycles is the Earth's eccentricity. Eccentricity is, simply, the shape of the Earth's orbit around the Sun. This constantly fluctuating, orbital shape ranges between more and less elliptical (0 to 5% ellipticity) on a cycle of about 100,000 years. These oscillations, from more elliptic to less elliptic, are of prime importance to glaciation in that it alters the distance from the Earth to the Sun, thus changing the distance the Sun's short wave radiation must travel to reach Earth, subsequently reducing or increasing the amount of radiation received at the Earth's surface in different seasons.
Today a difference of only about 3 percent occurs between aphelion (farthest point) and perihelion (closest point). This 3 percent difference in distance means that Earth experiences a 6 percent increase in received solar energy in January than in July. This 6 percent range of variability is not always the case, however. When the Earth's orbit is most elliptical the amount of solar energy received at the perihelion would be in the range of 20 to 30 percent more than at aphelion. Most certainly these continually altering amounts of received solar energy around the globe result in prominent changes in the Earth's climate and glacial regimes. At present the orbital eccentricity is nearly at the minimum of its cycle.
Axial Tilt
Axial tilt, the second of the three Milankovitch Cycles, is the inclination of the Earth's axis in relation to its plane of orbit around the Sun. Oscillations in the degree of Earth's axial tilt occur on a periodicity of 41,000 years from 21.5 to 24.5 degrees.
Today the Earth's axial tilt is about 23.5 degrees, which largely accounts for our seasons. Because of the periodic variations of this angle the severity of the Earth's seasons changes. With less axial tilt the Sun's solar radiation is more evenly distributed between winter and summer. However, less tilt also increases the difference in radiation receipts between the equatorial and polar regions.
One hypothesis for Earth's reaction to a smaller degree of axial tilt is that it would promote the growth of ice sheets. This response would be due to a warmer winter, in which warmer air would be able to hold more moisture, and subsequently produce a greater amount of snowfall. In addition, summer temperatures would be cooler, resulting in less melting of the winter's accumulation. At present, axial tilt is in the middle of its range.
Precession
The third and final of the Milankovitch Cycles is Earth's precession. Precession is the Earth's slow wobble as it spins on axis. This wobbling of the Earth on its axis can be likened to a top running down, and beginning to wobble back and forth on its axis. The precession of Earth wobbles from pointing at Polaris (North Star) to pointing at the star Vega. When this shift to the axis pointing at Vega occurs, Vega would then be considered the North Star. This top-like wobble, or precession, has a periodicity of 23,000 years.
Due to this wobble a climatically significant alteration must take place. When the axis is tilted towards Vega the positions of the Northern Hemisphere winter and summer solstices will coincide with the aphelion and perihelion, respectively. This means that the Northern Hemisphere will experience winter when the Earth is furthest from the Sun and summer when the Earth is closest to the Sun. This coincidence will result in greater seasonal contrasts. At present, the Earth is at perihelion very close to the winter solstice.
Most of the CO2 is not in the atmosphere. 98% of all CO2 is in the oceans (38,000 billion tons), and plants and soils (2,000 billion tons). Only 850 billion tons of CO2 is in the atmosphere (2% of the total CO2), and of that, less than 10% is man-made!
Over 90% of the atmospheric CO2 is produced naturally from decaying vegetation, fires, volcanoes, and the oceans. Also 80% of the world’s active volcanoes are under the sea bubbling out both liquid and gaseous CO2 and methane (and the sea is still alkaline). Indeed combustion reactions (power stations, fires, cars etc) produce CO2 and water, but it is the fine pollutant particles and chemicals (like oxides of sulphur and nitrogen) resulting from incomplete combustion that are the major problems affecting local temperatures, weather, as well as human health. Ruminating animals produce more greenhouse gases that all the buses, trucks and cars in the world combined!
Water by far the major greenhouse gas, cannot be controlled or taxed, so CO2 is measurable, blamed and potentially made taxable, even though most of it naturally occurring. But by contrast, in the sea, plankton growth from extra CO2 has grown tenfold over 50 years, and this is the main supplier of the oxygen that we breathe. Higher crop yields and greater vegetation growth rates have been reported worldwide due to the increased CO2 over the last 3 or so decades.
Dr Geoff Duffy, Professor Emeritus – Chemical Engineering, University of Auckland Fellow of the Royal Society, DEng, PhD, BSc, ASTC Dip, FRSNZ, FIChemE, CEng
On 22 September, the winter maximum ice sheet extent across the Antarctic reached its greatest area since satellite measurement of the ice extent began in 1979 [1].
This is consistent with satellite lower tropospheric temperature data for the South Polar region at Dr Roy Spencer’s Web site [2] which reveals a slight but not statistically significant rate of cooling for the region for the 36 years of satellite measurement.
Coinciding with this, measurements of the atmospheric CO2 have been collected by NOAA at the South Pole and the data is available on the World Meteorological Organisation Web site [3]. It shows that the CO2 concentration has increased by 17.7% in the same period.
Confirmation of this disparity is available on the WMO Web site where measurements by CSIRO are provided for the CO2 concentration at the Antarctic stations of Casey [4] and Mawson [5]. Comparison of the CO2 concentration with the station’s average temperature data, available at the Bureau of Meteorology Web site [6], showed that both stations have experienced slight, -0.78 deg C per century at Casey and -1.43 deg C per century at Mawson, but not statistically significant cooling over the terms of the measurement. However the CO2 concentration has increased at Casey by 9% in 16.5 years and at Mawson 11.4% in 23 years.
These results are clear evidence that the IPCC proposition that increasing atmospheric CO2 concentration causes warming of the Earth’s surface is invalid. As the rate of increase of atmospheric CO2 has been much the same across the whole of the globe, the above puts paid to the CO2 – global warming fraud.
Bevan Dockery, B.Sc.(Hons), Grad. Dip. Computing, retired geophysicist.
Formerly:
Fellow of the Australian Institute of Geoscientists,
Member of the Australian Society of Exploration Geophysicists,
Member of the Society of Exploration Geophysicists,
Member of the European Association of Exploration Geophysicists,
Member of the Australian Institute of Mining and Metallurgy.
BACK in the 1980s anthropogenic global warming was resurrected. Its emphasis was that man-made CO2 would dangerously heat up the world and had to be controlled.
And there was lots of money available if this could be proved. So a multi-billion dollar industry was born.
The first thing was to speed up the rate of warming. This was done by ignoring a large number of temperature measuring stations from cold areas like Siberia, places with altitude such as Bolivia and only one above the Arctic Circle. So far so good.
Two distractions were the Medieval Warm Period, and the Little Ice Age. Michael Mann removed those with his hockey stick graph. It has since been shown that feeding random numbers into his program always resulted in a hockey stick. It rapidly went from the 1995 IPCC report’s cover and Al Gore’s presentations into obscurity.
There was also a problem with the record high temperatures from the 1930s–1940s. To lower them, the major measuring agencies started to adjust the original temperatures. This can be legitimate if weather stations have been moved or their surroundings compromised. A photographic record of every station in the US shows that 80% are no longer correctly positioned mostly due to urbanisation (green fields are now asphalt parking lots). Logically the old readings should have been regarded as valid and current readings would need to be lowered. They’ve done the opposite.
They started reducing the temperatures pre-1960 (give or take) and increasing them since then. NOAA for example was adjusting temperatures this way by 0.01 Fahrenheit per month, but then went to doing it twice a month. But hey, when you’re on a good thing, do it more often! The Australian, NZ and GB BOMs, and the US’s NOAA and NASA have all been doing this. They have also stopped providing historical data to other weather forecasters.
Parts of NOAA were so concerned with their official figures they established 100 green field stations across the US. After 10 years they show a steady drop, whereas the “official” adjusted figures just keep rising. Satellite measurements, which are difficult to fudge, are also showing a stable or dropping temperature pattern.
So what does this all mean? Our temperature records have been modified to meaningless; the computer models are useless (87 of 89 major models can’t get within two standard deviations of actuals); the actuals haven’t risen for 17 years; our governments do not class CO2 as a pollutant (look it up); environmentalists should embrace the benefits of more CO2; windmills and commercial solar should be junked.
John Ibbotson, Gulmarrad NSW
First published in The Daily Examiner 5 Sep 2014
In 2007 John wrote and published one of the first Australian books sceptical of AGW: Planning Ahead For Future Generations, by Highlighting Climate Change Myths. www.lighthouses.com.au
Geologists reconstruct the Earth’s climate belts between 460 and 445 million years ago
An international team of scientists including Mark Williams and Jan Zalasiewicz of the Geology Department of the University of Leicester, and led by Dr. Thijs Vandenbroucke, formerly of Leicester and now at the University of Lille 1 (France), has reconstructed the Earth’s climate belts of the late Ordovician Period, between 460 and 445 million years ago.
The findings have been published online in the Proceedings of the National Academy of Sciences of the USA – and show that these ancient climate belts were surprisingly like those of the present.
The researchers state: “The world of the ancient past had been thought by scientists to differ from ours in many respects, including having carbon dioxide levels much higher – over twenty times as high – than those of the present. However, it is very hard to deduce carbon dioxide levels with any accuracy from such ancient rocks, and it was known that there was a paradox, for the late Ordovician was known to include a brief, intense glaciation – something difficult to envisage in a world with high levels of greenhouse gases. “
Reference: Vandenbroucke, T.R.A., Armstrong, H.A., Williams, M., Paris, F., Zalasiewicz, J.A., Sabbe, K., Nolvak, J., Challands, T.J., Verniers, J. & Servais, T. 2010. Polar front shift and atmospheric CO2 during the glacial maximum of the Early Paleozoic Icehouse. PNAS doi/10.1073/pnas.1003220107.
Contacts: (Mark Williams and Jan Zalasiewicz at the Department of Geology, University of Leicester: Respectively tel. 0116 252 3642 and 0116 2523928, and e-mails mri@le.ac.uk and jaz1@le.ac.uk).
In 1999, the leading expert on global warming knew that the US was cooling during “the time of rapidly increasing greenhouse gases”
The lack of warming was a political problem, so NASA altered the data.
Science Briefs Whither U.S. Climate? By James Hansen, Reto Ruedy, Jay Glascoe and Makiko Sato — August 1999
What’s happening to our climate? Was the heat wave and drought in the Eastern United States in 1999 a sign of global warming?
Empirical evidence does not lend much support to the notion that climate is headed precipitately toward more extreme heat and drought.
Yet in the U.S. there has been little temperature change in the past 50 years, the time of rapidly increasing greenhouse gases — in fact, there was a slight cooling throughout much of the country (Figure 2).
<This cooling was a political problem for them, so they erased it.>
In 1982 and 1983, NASA’s leading experts knew that sea level was rising very slowly
Again, they responded to this by dramatically altering the data.
The EPA knows that Obama White House claims about heat waves getting worse are false.
 05-29-2019, 12:31 PM


 0
0